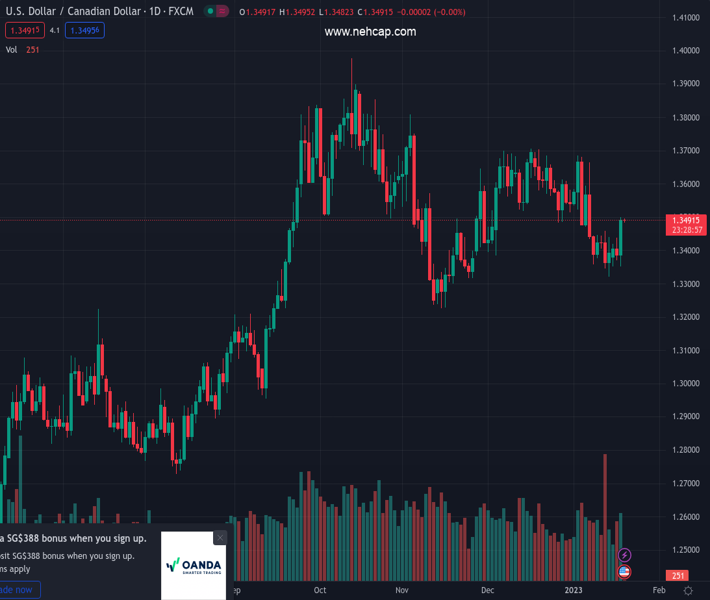
#USDCAD @ 1.34914 has witnessed an intermediate resistance around 1.3500 after a juggernaut rally. (Pivot Orderbook analysis)
…
This is a premium post.
[s2If !current_user_can(access_s2member_level4)]Please register for PREMIUM VERSION HERE to read full post below containing analysis. In case of any error or you think you are not able to read the full post below, please email us at support#nehcap.com [lwa][/s2If] [s2If current_user_can(access_s2member_level4)]
- USD/CAD has witnessed an intermediate resistance around 1.3500 after a juggernaut rally.
- US equities witnessed a massive sell-off as retail demand and PPI figures dropped heavily.
- Fed’s Bullard remained restrictive on interest rate projections despite weaker inflation projections.
The pair currently trades last at 1.34914.
The previous day high was 1.3437 while the previous day low was 1.3369. The daily 38.2% Fib levels comes at 1.3395, expected to provide support. Similarly, the daily 61.8% fib level is at 1.3411, expected to provide support.
The USD/CAD pair has witnessed a pause after a juggernaut rally around the psychological resistance of 1.3500 in the early Asian session. The Loonie asset is expected to turn sideways as the US Dollar bulls will need more fuel to extend the rally further. The major witnessed a steep fall amid a plunge in the oil price, which weakened the Canadian Dollar.
S&P500 witnessed an intense sell-off from the market participants after a lower-than-projected release of the United States Producer Price Index (PPI) and monthly Retail Sales data. The fight against stubborn inflation is demanding a cost from the economy in terms of weaker bargaining power in favor of producers and lower productivity due to rising interest rates by the Federal Reserve (Fed).
A sheer decline in the headline PPI (Dec) to 6.2% on an annual basis vs. the expectations of 6.8% and core PPI at 5.5% against the consensus of 5.9%, cleared that producers are forced to trim the prices of goods and services to maintain equilibrium due to declined retail demand. Apart from that, monthly Retail Sales data contracted by 1.1% while the street was expecting a contraction of -0.8%.
A decline in the US economic data cleared that inflation projections are expected to trim further, which supported the demand for US government bonds and a nosedive move in the 10-year US Treasury yields to 3.37%. The US Dollar Index (DXY) sensed a recovery after recording a fresh seven-month low at 101.20 to near 102.00 after hawkish commentary from St. Louis Fed’s President James Bullard. Fed policymaker projected the interest rate peak in a 5.25-5.50% range despite a sheer fall in US PPI and Retail Sales data.
On the oil front, oil prices dropped firmly as weaker retail demand in the United States is going to trim oil demand. Producers will be forced to slash their production activities amid falling retail demand, which might impact oil demand heavily. This led to a plunge in the oil price to $79.40. It is worth noting that Canada is a leading oil exporter to the United States and lower oil prices may impact the Canadian Dollar.
Technical Levels: Supports and Resistances
USDCAD currently trading at 1.3492 at the time of writing. Pair opened at 1.3388 and is trading with a change of 0.78 % .
| Overview | Overview.1 | |
|---|---|---|
| 0 | Today last price | 1.3492 |
| 1 | Today Daily Change | 0.0104 |
| 2 | Today Daily Change % | 0.7800 |
| 3 | Today daily open | 1.3388 |
The pair is trading below its 20 Daily moving average @ 1.351, below its 50 Daily moving average @ 1.3495 , below its 100 Daily moving average @ 1.3503 and above its 200 Daily moving average @ 1.3177
| Trends | Trends.1 | |
|---|---|---|
| 0 | Daily SMA20 | 1.3510 |
| 1 | Daily SMA50 | 1.3495 |
| 2 | Daily SMA100 | 1.3503 |
| 3 | Daily SMA200 | 1.3177 |
The previous day high was 1.3437 while the previous day low was 1.3369. The daily 38.2% Fib levels comes at 1.3395, expected to provide support. Similarly, the daily 61.8% fib level is at 1.3411, expected to provide support.
Note the levels of interest below:
- Pivot support is noted at 1.3359, 1.333, 1.3291
- Pivot resistance is noted at 1.3427, 1.3466, 1.3494
| Levels | Levels.1 |
|---|---|
| Previous Daily High | 1.3437 |
| Previous Daily Low | 1.3369 |
| Previous Weekly High | 1.3461 |
| Previous Weekly Low | 1.3322 |
| Previous Monthly High | 1.3705 |
| Previous Monthly Low | 1.3385 |
| Daily Fibonacci 38.2% | 1.3395 |
| Daily Fibonacci 61.8% | 1.3411 |
| Daily Pivot Point S1 | 1.3359 |
| Daily Pivot Point S2 | 1.3330 |
| Daily Pivot Point S3 | 1.3291 |
| Daily Pivot Point R1 | 1.3427 |
| Daily Pivot Point R2 | 1.3466 |
| Daily Pivot Point R3 | 1.3494 |
[/s2If]
Join Our Telegram Group
")


