US Retail Sales plummet while PPI cools down, effects of the Federal Reserve’s monetary policy. (Pivot Orderbook analysis)
…
This is a premium post.
[s2If !current_user_can(access_s2member_level4)]Please register for PREMIUM VERSION HERE to read full post below containing analysis. In case of any error or you think you are not able to read the full post below, please email us at support#nehcap.com [lwa][/s2If] [s2If current_user_can(access_s2member_level4)]
- US Retail Sales plummet while PPI cools down, effects of the Federal Reserve’s monetary policy.
- US Industrial Production stumbles for the second consecutive month.
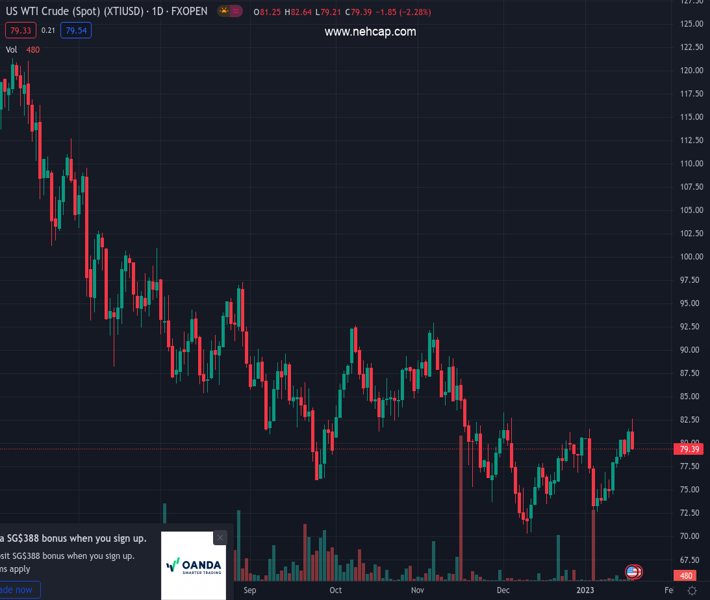
- WTI Price Analysis: Daily close below the 50-day EMA could exacerbate a fall beneath $78.00.
The pair currently trades last at 79.51.
The previous day high was 81.51 while the previous day low was 78.96. The daily 38.2% Fib levels comes at 80.53, expected to provide resistance. Similarly, the daily 61.8% fib level is at 79.93, expected to provide resistance.
The US crude oil Western Texas Intermediate collapsed from around daily highs reached during the North American session at $82.35 due to recession fears back in play following the release of soft US economic data. That, alongside hawkish Fed commentary, paired the greenback’s earlier losses, a headwind for oil prices. At the time of typing, WTI trades at $79.08 per barrel.
Wall Street’s finished Wednesday session with losses due to sentiment shifting sour on a gloomy economic outlook in the US. Inflation data at the factory gate, also known as the Producer Price Index (PPI) for December, plunged on its monthly reading, data that could encourage Fed officials to slow down the pace of rate hikes. Retail Sales for the same period shrank by some margin, while Industrial Production dropped.
“Coming on the back of the weakness in retail sales, the steep drop in industrial production and news of more job lay-offs adds to fears the US could already be in recession,” analysts at ING wrote in a note.
Another reason that put a lid on WTI’s rally was the comeback of the greenback. The US Dollar Index (DXY), a gauge of the buck’s value against a basket of six currencies, dropped to an 8-month low but bounced off and erased those losses, exchanging hands at 102.392, almost unchanged.
But what was the reason behind the US Dollar (USD) recovery? Two Fed officials, namely St. Louis Fed President James Bullard and Cleveland’s Loretta Mester, emphasized the need for the US Federal Reserve (Fed) to raise rates above the 5% threshold, with the former stating “as quickly as we can.”
In the meantime, China’s lifting of Covid-19 restrictions should boost oil demand, per the International Energy Agency (IEA)., though Russia’s oil embargo could dent supply.
From a daily chart perspective, WTI’s could continue to press upwards, though Wednesday’s high clashed and failed to break above the 100-day Exponential Moving Average (EMA) at $82.87 PB, exacerbating its drop towards $79.00, slightly below the 50-day EMA at 79.17. The Relative Strength Index (RSI), although above the 50 midlines, is accelerating toward its central line, about to cross under, which would open the door to open fresh shorts. WTI key support lie at $79.00, followed by $78.00 and the e0-day EMA at $77.73.
Technical Levels: Supports and Resistances
XTIUSD currently trading at 79.51 at the time of writing. Pair opened at 81.29 and is trading with a change of -2.19 % .
| Overview | Overview.1 | |
|---|---|---|
| 0 | Today last price | 79.51 |
| 1 | Today Daily Change | -1.78 |
| 2 | Today Daily Change % | -2.19 |
| 3 | Today daily open | 81.29 |
The pair is trading above its 20 Daily moving average @ 77.97, above its 50 Daily moving average @ 78.46 , below its 100 Daily moving average @ 82.03 and below its 200 Daily moving average @ 92.31
| Trends | Trends.1 | |
|---|---|---|
| 0 | Daily SMA20 | 77.97 |
| 1 | Daily SMA50 | 78.46 |
| 2 | Daily SMA100 | 82.03 |
| 3 | Daily SMA200 | 92.31 |
The previous day high was 81.51 while the previous day low was 78.96. The daily 38.2% Fib levels comes at 80.53, expected to provide resistance. Similarly, the daily 61.8% fib level is at 79.93, expected to provide resistance.
Note the levels of interest below:
- Pivot support is noted at 79.66, 78.03, 77.11
- Pivot resistance is noted at 82.21, 83.14, 84.77
| Levels | Levels.1 |
|---|---|
| Previous Daily High | 81.51 |
| Previous Daily Low | 78.96 |
| Previous Weekly High | 80.25 |
| Previous Weekly Low | 73.89 |
| Previous Monthly High | 83.30 |
| Previous Monthly Low | 70.27 |
| Daily Fibonacci 38.2% | 80.53 |
| Daily Fibonacci 61.8% | 79.93 |
| Daily Pivot Point S1 | 79.66 |
| Daily Pivot Point S2 | 78.03 |
| Daily Pivot Point S3 | 77.11 |
| Daily Pivot Point R1 | 82.21 |
| Daily Pivot Point R2 | 83.14 |
| Daily Pivot Point R3 | 84.77 |
[/s2If]
Join Our Telegram Group
")


