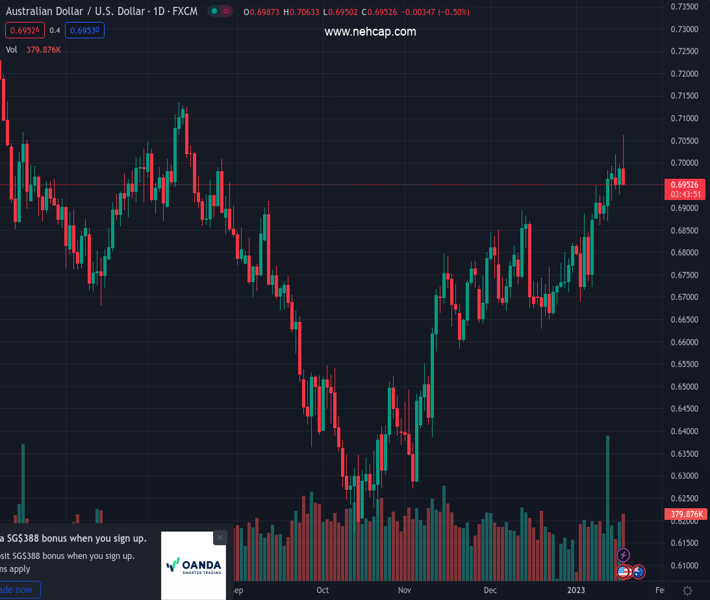
#AUDUSD @ 0.69516 After bad US data, reversed its course and dived below 0.7000. (Pivot Orderbook analysis)
…
This is a premium post.
[s2If !current_user_can(access_s2member_level4)]Please register for PREMIUM VERSION HERE to read full post below containing analysis. In case of any error or you think you are not able to read the full post below, please email us at support#nehcap.com [lwa][/s2If] [s2If current_user_can(access_s2member_level4)]
- After bad US data, AUD/USD reversed its course and dived below 0.7000.
- Federal Reserve officials pushed back against interest rates peaking below 5%.
- AUD/USD Price Analysis: FAilres at 0.7000, exacerbated the fall toward 0.6960s.
The pair currently trades last at 0.69516.
The previous day high was 0.6997 while the previous day low was 0.693. The daily 38.2% Fib levels comes at 0.6971, expected to provide resistance. Similarly, the daily 61.8% fib level is at 0.6956, expected to provide resistance.
AUD/USD erases its earlier gains after hitting a multi-month high at 0.7063, plunges below 0.7000, and turning down in the day by 0.27%. Risk appetite deteriorated amidst the lack of catalyst, though US data showed the economy is decelerating, which could have been the reason for sentiment shifting sour. The AUD/USD is trading at 0.6961.
Wall Street is registering losses between 0.77% and 1.21%. Retail Sales for December in the United States (US) were reported by the Commerce Department, with figures shrinking by 1.1% MoM, more than the 0.8% contraction estimated and worst than November’s downward revision to 1%. On an annual basis, sales were unchanged at 6%.
At the same time, the Department of Labor (DoL) revealed that the Producer Price Index (PPI) for December plunged to -0.5% MoM, smashing estimates of 0.1%. Year-over-year figures rose by 6.2%, beneath forecasts of 6.8%, while core PPI advanced 5.5%, vs. 5.7% estimates.
Aside from that, the Federal Reserve reported that Industrial Production in the US decreased -0.7% in December and -1.7% in Q4. Additionally, US manufacturing output fell -1.3% last month, albeit November’s data was downward revised -1.3%.
Elsewhere a slew of Federal Reserve officials, led by the St. Louis Fed President James Bullard, crossed wires. Bullard said policymakers should get “as quickly” as they can rate above 5%. Echoing some of his comments, Cleveland’s Fed President Loretta Mester said that rates need to rise “a little bit” above 5%, emphasizing that it would be needed according to her projections.
After those remarks, the AUD/USD reversed its course after trading above the 0.7000 mark. No catalyst spurred the market’s reaction, only hawkish comments by Fed officials, which had been repeated since the beginning of the year.
From a technical perspective, the AUD/USD daily chart is forming an inverted hammer, which, if it closes below Tuesday’s open of 0.697, would exacerbate a deeper pullback, with the 20-day Exponential Moving Average (EMA) at 0.6863 as the first support. AUD/USD price action achieved successive series of higher highs, while the Relative Strength Index (RSI) failed to crack its previous peak. So, a negative divergence between price action and the RSI could pave the way for further downside.
The AUD/USD key support levels would be the January 17 low of 0.6929, followed by the January 12 daily low of 0.6869, ahead of the abovementioned 20-day EMA at 0.6863.
Technical Levels: Supports and Resistances
AUDUSD currently trading at 0.696 at the time of writing. Pair opened at 0.6986 and is trading with a change of -0.37 % .
| Overview | Overview.1 | |
|---|---|---|
| 0 | Today last price | 0.6960 |
| 1 | Today Daily Change | -0.0026 |
| 2 | Today Daily Change % | -0.3700 |
| 3 | Today daily open | 0.6986 |
The pair remains strongly bullish on the daily timeframe. It trades above its 20 SMA @ 0.6823, 50 SMA 0.6758, 100 SMA @ 0.6637 and 200 SMA @ 0.6827.
| Trends | Trends.1 | |
|---|---|---|
| 0 | Daily SMA20 | 0.6823 |
| 1 | Daily SMA50 | 0.6758 |
| 2 | Daily SMA100 | 0.6637 |
| 3 | Daily SMA200 | 0.6827 |
The previous day high was 0.6997 while the previous day low was 0.693. The daily 38.2% Fib levels comes at 0.6971, expected to provide resistance. Similarly, the daily 61.8% fib level is at 0.6956, expected to provide resistance.
Note the levels of interest below:
- Pivot support is noted at 0.6945, 0.6904, 0.6877
- Pivot resistance is noted at 0.7012, 0.7038, 0.708
| Levels | Levels.1 |
|---|---|
| Previous Daily High | 0.6997 |
| Previous Daily Low | 0.6930 |
| Previous Weekly High | 0.6994 |
| Previous Weekly Low | 0.6860 |
| Previous Monthly High | 0.6893 |
| Previous Monthly Low | 0.6629 |
| Daily Fibonacci 38.2% | 0.6971 |
| Daily Fibonacci 61.8% | 0.6956 |
| Daily Pivot Point S1 | 0.6945 |
| Daily Pivot Point S2 | 0.6904 |
| Daily Pivot Point S3 | 0.6877 |
| Daily Pivot Point R1 | 0.7012 |
| Daily Pivot Point R2 | 0.7038 |
| Daily Pivot Point R3 | 0.7080 |
[/s2If]
Join Our Telegram Group
")


