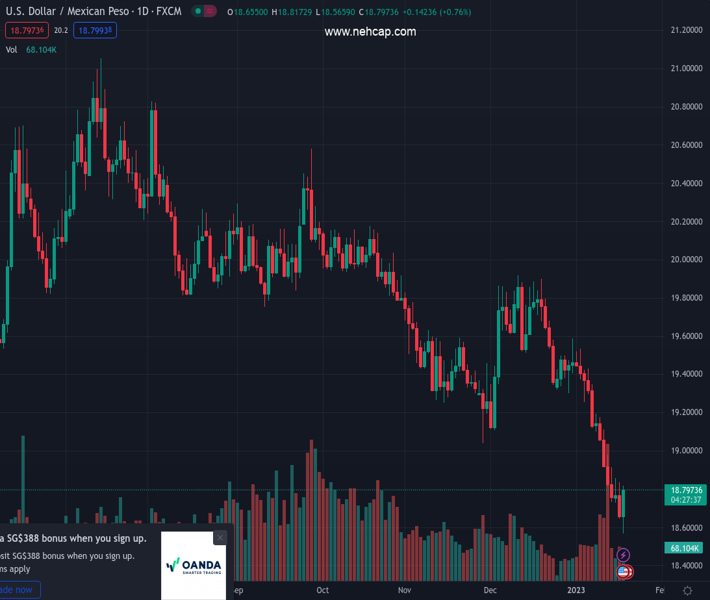
#USDMXN @ 18.7943 rebounds sharply from lowest level in almost three years. (Pivot Orderbook analysis)
…
This is a premium post.
[s2If !current_user_can(access_s2member_level4)]Please register for PREMIUM VERSION HERE to read full post below containing analysis. In case of any error or you think you are not able to read the full post below, please email us at support#nehcap.com [lwa][/s2If] [s2If current_user_can(access_s2member_level4)]
- USD/MXN rebounds sharply from lowest level in almost three years.
- Strong support area above 18.50 and risk aversion triggers rebound.
The pair currently trades last at 18.7943.
The previous day high was 18.8343 while the previous day low was 18.6649. The daily 38.2% Fib levels comes at 18.7296, expected to provide support. Similarly, the daily 61.8% fib level is at 18.7696, expected to provide support.
The USD/MXN is rising on Wednesday after hitting at 18.55, the lowest level since February 2020. The rebound represents a correction after falling constantly since the beginning of the year.
The ongoing run is facing resistance at 18.75. A break higher would target 18.85. The next vital resistance stands at 19.00/05 that should limit the upside. Above then comes 19.20 that if broken should weaken the Mexican Peso.
A deterioration in market sentiment favored the correction in USD/MXN that would continue to receive support as stocks in Wall Street keep falling.
The Mexican peso needs to hold below 18.70 in order to keep the doors open to another test of the 18.55 area and the 2020 low at 18.50. A break lower would target 18.30
Technical Levels: Supports and Resistances
USDMXN currently trading at 18.7619 at the time of writing. Pair opened at 18.6733 and is trading with a change of 0.47 % .
| Overview | Overview.1 | |
|---|---|---|
| 0 | Today last price | 18.7619 |
| 1 | Today Daily Change | 0.0886 |
| 2 | Today Daily Change % | 0.4700 |
| 3 | Today daily open | 18.6733 |
The pair remains strongly bearish on the daily time frame. It trades below the 20 SMA @ 19.2377, 50 SMA 19.404, 100 SMA @ 19.6887 and 200 SMA @ 19.9253.
| Trends | Trends.1 | |
|---|---|---|
| 0 | Daily SMA20 | 19.2377 |
| 1 | Daily SMA50 | 19.4040 |
| 2 | Daily SMA100 | 19.6887 |
| 3 | Daily SMA200 | 19.9253 |
The previous day high was 18.8343 while the previous day low was 18.6649. The daily 38.2% Fib levels comes at 18.7296, expected to provide support. Similarly, the daily 61.8% fib level is at 18.7696, expected to provide support.
Note the levels of interest below:
- Pivot support is noted at 18.6141, 18.5548, 18.4447
- Pivot resistance is noted at 18.7835, 18.8936, 18.9528
| Levels | Levels.1 |
|---|---|
| Previous Daily High | 18.8343 |
| Previous Daily Low | 18.6649 |
| Previous Weekly High | 19.1951 |
| Previous Weekly Low | 18.7331 |
| Previous Monthly High | 19.9181 |
| Previous Monthly Low | 19.1084 |
| Daily Fibonacci 38.2% | 18.7296 |
| Daily Fibonacci 61.8% | 18.7696 |
| Daily Pivot Point S1 | 18.6141 |
| Daily Pivot Point S2 | 18.5548 |
| Daily Pivot Point S3 | 18.4447 |
| Daily Pivot Point R1 | 18.7835 |
| Daily Pivot Point R2 | 18.8936 |
| Daily Pivot Point R3 | 18.9528 |
[/s2If]
Join Our Telegram Group
")


