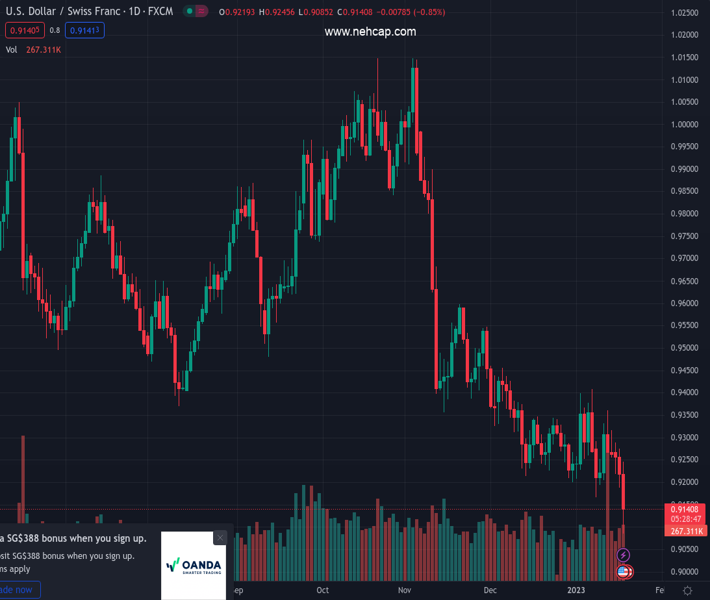
#USDCHF @ 0.91324 Swiss Franc rises sharply versus Dollar and Euro. (Pivot Orderbook analysis)
…
This is a premium post.
[s2If !current_user_can(access_s2member_level4)]Please register for PREMIUM VERSION HERE to read full post below containing analysis. In case of any error or you think you are not able to read the full post below, please email us at support#nehcap.com [lwa][/s2If] [s2If current_user_can(access_s2member_level4)]
- Swiss Franc rises sharply versus Dollar and Euro.
- Expectations about a less hawkish ECB support the Swiss Franc.
- USD/CHF falls for the fifth consecutive day on Wednesday.
The pair currently trades last at 0.91324.
The previous day high was 0.9276 while the previous day low was 0.9188. The daily 38.2% Fib levels comes at 0.9222, expected to provide resistance. Similarly, the daily 61.8% fib level is at 0.9243, expected to provide resistance.
The USD/CHF is falling by almost a hundred pips on Wednesday after trimming some losses during the last hour. The pair bottomed at 0.9084, the lowest level since November 2021 and then rebounded rising back above 0.9100.
The decline in European and US government bond yields weakened the US Dollar and favored the Swiss Franc. The Switzerland 10-year bond yield dropped to 1.05%, the lowest since early December and the US 10-year yield fell to 3.38%, lowest since September.
The demand for European bond strengthened after data showed a slowdown in inflation and some “not so bad” activity figures; and particularly following a media report on Tuesday that mentioned European Central Bank policymakers are starting to consider a slower pace of interest rate hikes after the February meeting.
Expectations of a less hawkish ECB sent the Euro to the downside, and it continues to be a drag. EUR/CHF has fallen sharply, reversing sharply from six-month highs near 1.0100 to levels under 0.9900.
Economic data released on Wednesday weighed further on USD/CHF. Inflation numbers came in below expectations, while Retail Sales and Industrial Production dropped more than market consensus.
The USD/CHF is consolidating below 0.9200, reinforcing the bearish bias. On the flip side, the next critical support is the 0.9100 area. A daily close below would open the doors to more losses. A recovery back above 0.9220 would alleviate the negative tone.
Technical Levels: Supports and Resistances
USDCHF currently trading at 0.9111 at the time of writing. Pair opened at 0.922 and is trading with a change of -1.18 % .
| Overview | Overview.1 | |
|---|---|---|
| 0 | Today last price | 0.9111 |
| 1 | Today Daily Change | -0.0109 |
| 2 | Today Daily Change % | -1.1800 |
| 3 | Today daily open | 0.9220 |
The pair remains strongly bearish on the daily time frame. It trades below the 20 SMA @ 0.9282, 50 SMA 0.9373, 100 SMA @ 0.9615 and 200 SMA @ 0.9643.
| Trends | Trends.1 | |
|---|---|---|
| 0 | Daily SMA20 | 0.9282 |
| 1 | Daily SMA50 | 0.9373 |
| 2 | Daily SMA100 | 0.9615 |
| 3 | Daily SMA200 | 0.9643 |
The previous day high was 0.9276 while the previous day low was 0.9188. The daily 38.2% Fib levels comes at 0.9222, expected to provide resistance. Similarly, the daily 61.8% fib level is at 0.9243, expected to provide resistance.
Note the levels of interest below:
- Pivot support is noted at 0.918, 0.9139, 0.9091
- Pivot resistance is noted at 0.9268, 0.9317, 0.9357
| Levels | Levels.1 |
|---|---|
| Previous Daily High | 0.9276 |
| Previous Daily Low | 0.9188 |
| Previous Weekly High | 0.9363 |
| Previous Weekly Low | 0.9167 |
| Previous Monthly High | 0.9471 |
| Previous Monthly Low | 0.9201 |
| Daily Fibonacci 38.2% | 0.9222 |
| Daily Fibonacci 61.8% | 0.9243 |
| Daily Pivot Point S1 | 0.9180 |
| Daily Pivot Point S2 | 0.9139 |
| Daily Pivot Point S3 | 0.9091 |
| Daily Pivot Point R1 | 0.9268 |
| Daily Pivot Point R2 | 0.9317 |
| Daily Pivot Point R3 | 0.9357 |
[/s2If]
Join Our Telegram Group
")


