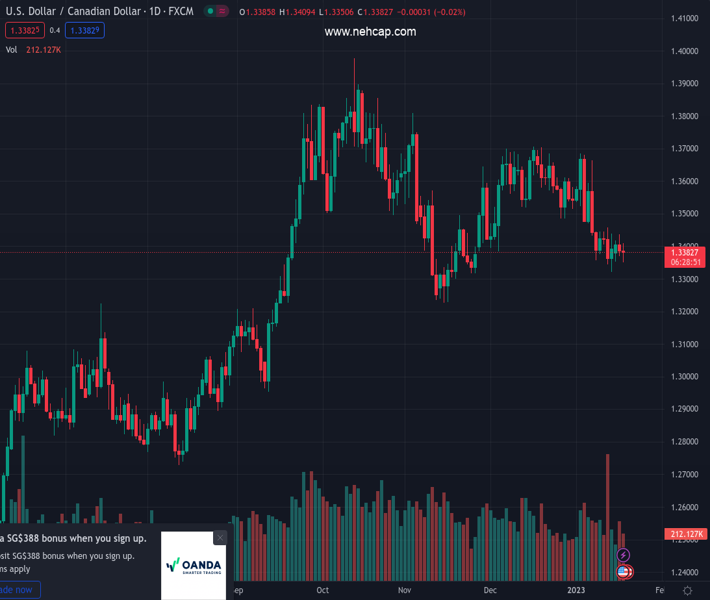
#USDCAD @ 1.33799 US Dollar weakens across the board after US data. (Pivot Orderbook analysis)
…
This is a premium post.
[s2If !current_user_can(access_s2member_level4)]Please register for PREMIUM VERSION HERE to read full post below containing analysis. In case of any error or you think you are not able to read the full post below, please email us at support#nehcap.com [lwa][/s2If] [s2If current_user_can(access_s2member_level4)]
- US Dollar weakens across the board after US data.
- Loonie among wakens currencies following Canadian inflation numbers.
- USD/CAD slightly below 1.3400, without clear direction.
The pair currently trades last at 1.33799.
The previous day high was 1.3437 while the previous day low was 1.3369. The daily 38.2% Fib levels comes at 1.3395, expected to provide resistance. Similarly, the daily 61.8% fib level is at 1.3411, expected to provide resistance.
The USD/CAD is moving toward 1.3400 as the US Dollar trims some of its recent losses that followed the releases of US economic data. The pair held around daily highs despite the slide of the greenback supported by Canadian data.
Inflation numbers from Canada came in below expectations on Wednesday. The Industrial Product Price Index (IPPI) declined 1.1% month over month, lower than the slide of 0.3% of market consensus. Compared to a year ago it was up 7.6%. The Raw Materials Price Index (RMPI) fell 3.1% in December against expectations of a 1.3% slide.
“These decreases were partially influenced by lower prices for crude oil, which fell partially on macroeconomic concerns as well as global production slightly in excess of demand. Diesel prices remained relatively higher than gasoline prices, partially due to the effects of the Russian invasion of Ukraine. Russia was a major supplier of diesel to Europe, which increased its imports from other sources”, said Statistics Canada in its report.
The Loonie weakened after the numbers. The USD/CAD held around 1.3375 after the numbers even amid a slide of the US Dollar following US data. In the US, the Producer Price Index declined 0.5% in December, versus market consensus of a 0.1% slide; and the annual rate dropped to 6.2%, the lowest since March 2021. A different report showed Retail Sales fell 1.1% in December, more than the 0.8% decline expected. Industrial Production contracted by 0.7% in December.
US bond yields tumbled after the numbers, hitting fresh multi-day lows across the curve. The DXY fell below 101.80, to the lowest level since May.
Despite the weaker dollar, USD/CAD is hovering near 1.3400, moving without a clear direction. On the upside, the pair faces initial resistance at 1.3410 and then 1.3445/50. A consolidation above 1.3450 should open the doors to more gains. On the flip side, support is located at 1.3365 followed by 1.3350 (daily low).
On a wider perspective, risks are tilted to the downside in USD/CAD. Losses seem limited as long as it holds above 1.3350 on a closing basis.
Technical Levels: Supports and Resistances
USDCAD currently trading at 1.3377 at the time of writing. Pair opened at 1.3388 and is trading with a change of -0.08 % .
| Overview | Overview.1 | |
|---|---|---|
| 0 | Today last price | 1.3377 |
| 1 | Today Daily Change | -0.0011 |
| 2 | Today Daily Change % | -0.0800 |
| 3 | Today daily open | 1.3388 |
The pair is trading below its 20 Daily moving average @ 1.351, below its 50 Daily moving average @ 1.3495 , below its 100 Daily moving average @ 1.3503 and above its 200 Daily moving average @ 1.3177
| Trends | Trends.1 | |
|---|---|---|
| 0 | Daily SMA20 | 1.3510 |
| 1 | Daily SMA50 | 1.3495 |
| 2 | Daily SMA100 | 1.3503 |
| 3 | Daily SMA200 | 1.3177 |
The previous day high was 1.3437 while the previous day low was 1.3369. The daily 38.2% Fib levels comes at 1.3395, expected to provide resistance. Similarly, the daily 61.8% fib level is at 1.3411, expected to provide resistance.
Note the levels of interest below:
- Pivot support is noted at 1.3359, 1.333, 1.3291
- Pivot resistance is noted at 1.3427, 1.3466, 1.3494
| Levels | Levels.1 |
|---|---|
| Previous Daily High | 1.3437 |
| Previous Daily Low | 1.3369 |
| Previous Weekly High | 1.3461 |
| Previous Weekly Low | 1.3322 |
| Previous Monthly High | 1.3705 |
| Previous Monthly Low | 1.3385 |
| Daily Fibonacci 38.2% | 1.3395 |
| Daily Fibonacci 61.8% | 1.3411 |
| Daily Pivot Point S1 | 1.3359 |
| Daily Pivot Point S2 | 1.3330 |
| Daily Pivot Point S3 | 1.3291 |
| Daily Pivot Point R1 | 1.3427 |
| Daily Pivot Point R2 | 1.3466 |
| Daily Pivot Point R3 | 1.3494 |
[/s2If]
Join Our Telegram Group
")


