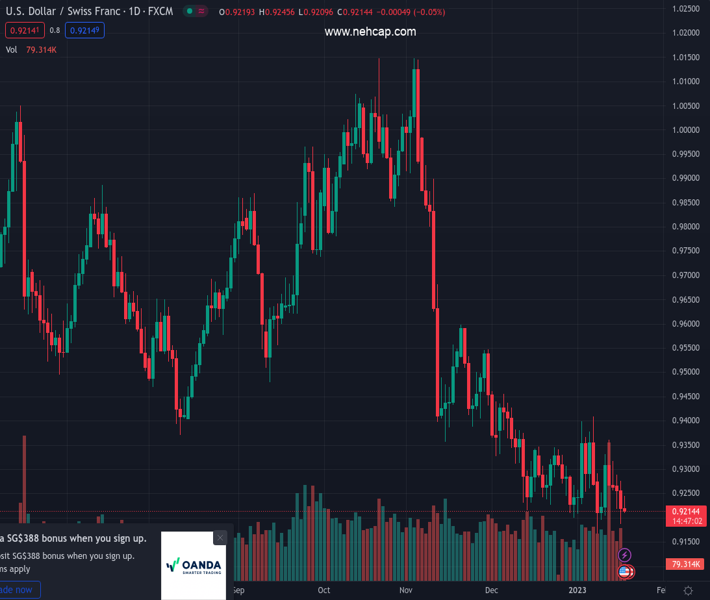
#USDCHF @ 0.92160 prints the biggest daily gain in a week despite retreating from intraday high., @nehcap view: Further downside expected (Pivot Orderbook analysis)
…
This is a premium post.
[s2If !current_user_can(access_s2member_level4)]Please register for PREMIUM VERSION HERE to read full post below containing analysis. In case of any error or you think you are not able to read the full post below, please email us at support#nehcap.com [lwa][/s2If] [s2If current_user_can(access_s2member_level4)]
- USD/CHF prints the biggest daily gain in a week despite retreating from intraday high.
- Convergence of one-week-old descending trend line, 50-HMA restricts immediate upside.
- MACD, RSI also suggest a reduction in bullish momentum.
The pair currently trades last at 0.92160.
The previous day high was 0.9276 while the previous day low was 0.9188. The daily 38.2% Fib levels comes at 0.9222, expected to provide resistance. Similarly, the daily 61.8% fib level is at 0.9243, expected to provide resistance.
USD/CHF retreats from intraday high to 0.9225 amid the initial hour of Wednesday’s European session as bulls take a breather ahead of the key US data. Even so, the quote braces for the biggest daily gains in a week.
In doing so, the Swiss currency (CHF) pair takes a U-turn from the 50-HMA, as well as a downward-sloping resistance line from the last Thursday, close to 0.9245 by the press time.
It’s worth noting that the receding bullish bias of the MACD signals and the downward-sloping RSI (14) line also raises doubts about the USD/CHF pair’s latest recovery.
That said, the 0.9200 threshold and the recent low surrounding 0.9185 could lure intraday sellers of the USD/CHF pair ahead of directing them to the monthly bottom of 0.9167.
In a case where the quote remains bearish past 0.9167, the odds of witnessing a slump toward the March 2022 low of 0.9150 and then to the 0.9100 round figure can’t be ruled out.
On the flip side, recovery moves must remain successfully beyond the 0.9245 resistance confluence to convince USD/CHF buyers.
Following that, the previous weekly high of 0.9362 and the monthly peak close to 0.9410 could lure the bulls.
It should be observed, however, that the upside momentum remains elusive unless the pair trades below the August 2022 bottom near 0.9370.
Trend: Further downside expected
Technical Levels: Supports and Resistances
USDCHF currently trading at 0.9228 at the time of writing. Pair opened at 0.922 and is trading with a change of 0.09% % .
| Overview | Overview.1 | |
|---|---|---|
| 0 | Today last price | 0.9228 |
| 1 | Today Daily Change | 0.0008 |
| 2 | Today Daily Change % | 0.09% |
| 3 | Today daily open | 0.922 |
The pair remains strongly bearish on the daily time frame. It trades below the 20 SMA @ 0.9282, 50 SMA 0.9373, 100 SMA @ 0.9615 and 200 SMA @ 0.9643.
| Trends | Trends.1 | |
|---|---|---|
| 0 | Daily SMA20 | 0.9282 |
| 1 | Daily SMA50 | 0.9373 |
| 2 | Daily SMA100 | 0.9615 |
| 3 | Daily SMA200 | 0.9643 |
The previous day high was 0.9276 while the previous day low was 0.9188. The daily 38.2% Fib levels comes at 0.9222, expected to provide resistance. Similarly, the daily 61.8% fib level is at 0.9243, expected to provide resistance.
Note the levels of interest below:
- Pivot support is noted at 0.918, 0.9139, 0.9091
- Pivot resistance is noted at 0.9268, 0.9317, 0.9357
| Levels | Levels.1 |
|---|---|
| Previous Daily High | 0.9276 |
| Previous Daily Low | 0.9188 |
| Previous Weekly High | 0.9363 |
| Previous Weekly Low | 0.9167 |
| Previous Monthly High | 0.9471 |
| Previous Monthly Low | 0.9201 |
| Daily Fibonacci 38.2% | 0.9222 |
| Daily Fibonacci 61.8% | 0.9243 |
| Daily Pivot Point S1 | 0.9180 |
| Daily Pivot Point S2 | 0.9139 |
| Daily Pivot Point S3 | 0.9091 |
| Daily Pivot Point R1 | 0.9268 |
| Daily Pivot Point R2 | 0.9317 |
| Daily Pivot Point R3 | 0.9357 |
[/s2If]
Join Our Telegram Group
")


