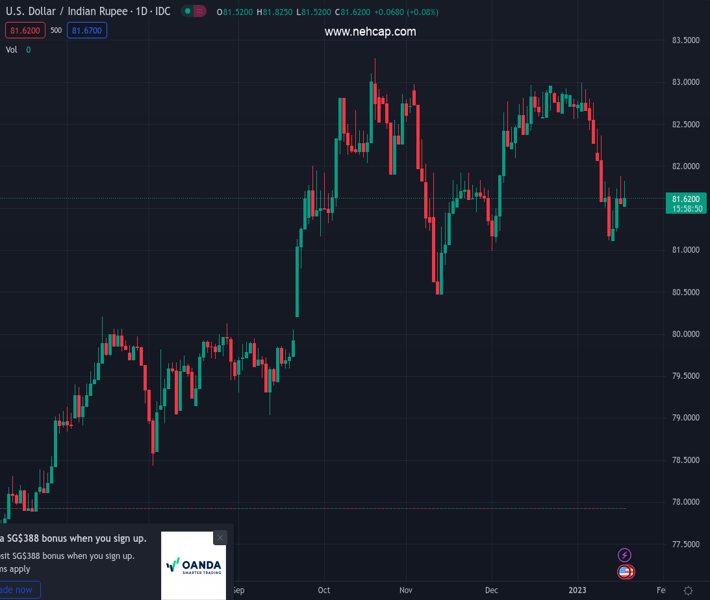
#USDINR @ 81.6370 picks up bids to reverse the previous day’s pullback from one-week high. (Pivot Orderbook analysis)
…
This is a premium post.
[s2If !current_user_can(access_s2member_level4)]Please register for PREMIUM VERSION HERE to read full post below containing analysis. In case of any error or you think you are not able to read the full post below, please email us at support#nehcap.com [lwa][/s2If] [s2If current_user_can(access_s2member_level4)]
- USD/INR picks up bids to reverse the previous day’s pullback from one-week high.
- Bank of Japan’s inaction drowned Treasury bond yields, underpinned US Dollar demand.
- Increased hedging by Indian importers, foreign outflows weigh on the INR.
- US Retail Sales, PPI will be crucial to forecast further USD run-up.
The pair currently trades last at 81.6370.
The previous day high was 81.8865 while the previous day low was 81.5175. The daily 38.2% Fib levels comes at 81.6585, expected to provide resistance. Similarly, the daily 61.8% fib level is at 81.7455, expected to provide resistance.
USD/INR grinds higher past 81.50, around 81.70 by the press time, as bond buyers underpin the US Dollar run-up during early Wednesday. Also adding strength to the Indian Rupee (INR) pair could be the chatters of increased hedging by importers and foreign outflows from India.
“Average dollar purchases by importers, beyond the spot date, rose to $1.64 billion last week from $1.14 billion the week before, latest data collated by The Clearing Corporation of India Ltd (CCIL) revealed,” stated Reuters while suggesting an increase in hedging in India. On the same line, Reuters quotes data to mention about a 246.51 billion rupees ($3.02 billion) outflow by Foreign institutional investors in the last 17 days to portray challenges for the INR.
Elsewhere, the receding optimism surrounding China as expectations of upbeat growth figures from China, as conveyed by economists from Goldman Sachs, contrast the fears of more Sino-American tussles over Taiwan to probe China-linked optimism. Earlier in the day, South China Morning Post (SCMP) mentioned that Beijing ‘should be wary’ as the US and Taiwan seeks closer economic ties.
Above all, a slump in the Treasury bond yields triggered by the Bank of Japan’s (BoJ) inaction seemed to have underpinned the US Dollar run-up. That said, the US Dollar Index (DXY) braces for the biggest daily gains in two weeks, up for the third consecutive day around 102.90 by the press time. US Treasury bond yields as they reverse the early-day rebound to drop towards 3.48% while the S&P 500 futures printed 0.30% intraday gains, following the mildly negative marks of the intraday performance. On the same line, Japanese Government Bonds (JGB) slumped to 0.362% after the BoJ announcements from 0.50% just before the BOJ.
Amid these plays, stocks in Asia remain firmer, led by Nikkei 225, whereas the S&P 500 Futures also seesaws around the monthly high past 4,000 by the press time.
Moving on, USD/INR traders should pay attention to the US US Retail Sales and Producers Price Index for December, expected 0.1% and -0.1% MoM versus -0.6% and 0.3% respective priors, for clear directions.
After a one-week-long stay below the 100-DMA, around 81.70 by the press time, the USD/INR pair struggles to regain its place beyond the stated key moving average. However, downbeat MACD and RSI (14) challenge the buyers.
Technical Levels: Supports and Resistances
USDINR currently trading at 81.6785 at the time of writing. Pair opened at 81.5175 and is trading with a change of 0.2 % .
| Overview | Overview.1 | |
|---|---|---|
| 0 | Today last price | 81.6785 |
| 1 | Today Daily Change | 0.1610 |
| 2 | Today Daily Change % | 0.2000 |
| 3 | Today daily open | 81.5175 |
The pair is trading below its 20 Daily moving average @ 82.3213, below its 50 Daily moving average @ 82.0143 , below its 100 Daily moving average @ 81.6849 and above its 200 Daily moving average @ 80.004
| Trends | Trends.1 | |
|---|---|---|
| 0 | Daily SMA20 | 82.3213 |
| 1 | Daily SMA50 | 82.0143 |
| 2 | Daily SMA100 | 81.6849 |
| 3 | Daily SMA200 | 80.0040 |
The previous day high was 81.8865 while the previous day low was 81.5175. The daily 38.2% Fib levels comes at 81.6585, expected to provide resistance. Similarly, the daily 61.8% fib level is at 81.7455, expected to provide resistance.
Note the levels of interest below:
- Pivot support is noted at 81.3945, 81.2715, 81.0255
- Pivot resistance is noted at 81.7635, 82.0095, 82.1325
| Levels | Levels.1 |
|---|---|
| Previous Daily High | 81.8865 |
| Previous Daily Low | 81.5175 |
| Previous Weekly High | 82.5294 |
| Previous Weekly Low | 81.0769 |
| Previous Monthly High | 84.2500 |
| Previous Monthly Low | 80.9855 |
| Daily Fibonacci 38.2% | 81.6585 |
| Daily Fibonacci 61.8% | 81.7455 |
| Daily Pivot Point S1 | 81.3945 |
| Daily Pivot Point S2 | 81.2715 |
| Daily Pivot Point S3 | 81.0255 |
| Daily Pivot Point R1 | 81.7635 |
| Daily Pivot Point R2 | 82.0095 |
| Daily Pivot Point R3 | 82.1325 |
[/s2If]
Join Our Telegram Group
")


