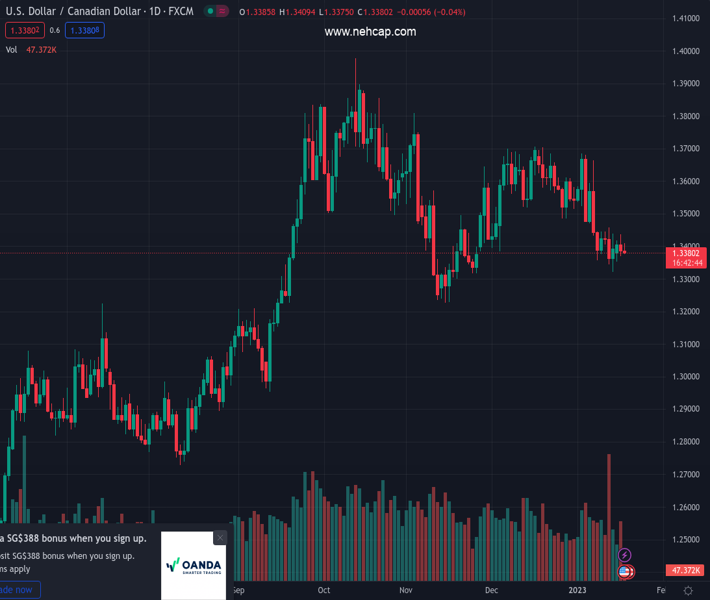
#USDCAD @ 1.33799 turns lower for the second straight day, albeit lacks follow-through selling. (Pivot Orderbook analysis)
…
This is a premium post.
[s2If !current_user_can(access_s2member_level4)]Please register for PREMIUM VERSION HERE to read full post below containing analysis. In case of any error or you think you are not able to read the full post below, please email us at support#nehcap.com [lwa][/s2If] [s2If current_user_can(access_s2member_level4)]
- USD/CAD turns lower for the second straight day, albeit lacks follow-through selling.
- Bullish crude oil prices underpin the Loonie and act as a headwind for the major.
- Broad-based USD strength lends some support ahead of important US macro data.
The pair currently trades last at 1.33799.
The previous day high was 1.3437 while the previous day low was 1.3369. The daily 38.2% Fib levels comes at 1.3395, expected to provide resistance. Similarly, the daily 61.8% fib level is at 1.3411, expected to provide resistance.
The USD/CAD pair attracts some sellers following an early uptick to the 1.3410 area dips into negative territory for the second straight day on Wednesday. The pair is currently placed near the daily low, around the 1.3380 region, and looks to extend the previous day’s pullback from the weekly top.
Crude oil prices stand tall near the monthly peak amid optimism over a recovery in Chinese fuel demand. This, in turn, underpins the commodity-linked Loonie and acts as a headwind for the USD/CAD pair. That said, a combination of factors should help limit deeper losses for the major and warrants some caution before placing aggressive intraday bearish bets.
Worries about a deeper global economic downturn might cap crude oil prices, which, along with a sharp deceleration in Canadian consumer inflation, could act as a headwind for the Canadian Dollar. Apart from this, resurgent US Dollar demand, bolstered by the Bank of Japan-inspired sell-off in the Japanese Yen, should further lend support to the USD/CAD pair.
The USD rally, meanwhile, is likely to run out of steam amid a fresh leg down in the US Treasury bond yields, weighed down by growing acceptance that the Fed will soften its hawkish stance. In fact, the current market pricing points to a greater chance of a smaller 25 bps Fed rate hike move in February, which should keep a lid on the greenback.
The aforementioned fundamental backdrop, along with repeated failures to find acceptance above the 1.3400 mark, favour bearish traders. That said, it will still be prudent to wait for strong follow-through selling below mid-1.3300s before positioning for any further depreciating move as traders now look to important US macro data for a fresh impetus.
Wednesday’s US economic docket highlights the release of the Producer Price Index (PPI) and monthly Retail Sales figures, due later during the early North American session. Apart from this, the US bond yields might influence the USD demand. Traders will further take cues from oil price dynamics to grab short-term opportunities around the USD/CAD pair.
Technical Levels: Supports and Resistances
USDCAD currently trading at 1.3377 at the time of writing. Pair opened at 1.3388 and is trading with a change of -0.08 % .
| Overview | Overview.1 | |
|---|---|---|
| 0 | Today last price | 1.3377 |
| 1 | Today Daily Change | -0.0011 |
| 2 | Today Daily Change % | -0.0800 |
| 3 | Today daily open | 1.3388 |
The pair is trading below its 20 Daily moving average @ 1.351, below its 50 Daily moving average @ 1.3495 , below its 100 Daily moving average @ 1.3503 and above its 200 Daily moving average @ 1.3177
| Trends | Trends.1 | |
|---|---|---|
| 0 | Daily SMA20 | 1.3510 |
| 1 | Daily SMA50 | 1.3495 |
| 2 | Daily SMA100 | 1.3503 |
| 3 | Daily SMA200 | 1.3177 |
The previous day high was 1.3437 while the previous day low was 1.3369. The daily 38.2% Fib levels comes at 1.3395, expected to provide resistance. Similarly, the daily 61.8% fib level is at 1.3411, expected to provide resistance.
Note the levels of interest below:
- Pivot support is noted at 1.3359, 1.333, 1.3291
- Pivot resistance is noted at 1.3427, 1.3466, 1.3494
| Levels | Levels.1 |
|---|---|
| Previous Daily High | 1.3437 |
| Previous Daily Low | 1.3369 |
| Previous Weekly High | 1.3461 |
| Previous Weekly Low | 1.3322 |
| Previous Monthly High | 1.3705 |
| Previous Monthly Low | 1.3385 |
| Daily Fibonacci 38.2% | 1.3395 |
| Daily Fibonacci 61.8% | 1.3411 |
| Daily Pivot Point S1 | 1.3359 |
| Daily Pivot Point S2 | 1.3330 |
| Daily Pivot Point S3 | 1.3291 |
| Daily Pivot Point R1 | 1.3427 |
| Daily Pivot Point R2 | 1.3466 |
| Daily Pivot Point R3 | 1.3494 |
[/s2If]
Join Our Telegram Group
")


