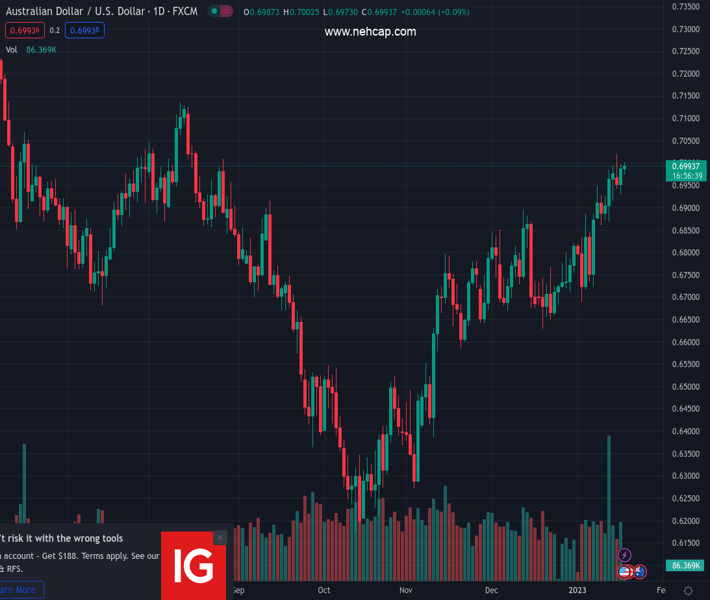
#AUDUSD @ 0.69920 struggles to preserve its modest intraday gains amid broad-based USD strength. (Pivot Orderbook analysis)
…
This is a premium post.
[s2If !current_user_can(access_s2member_level4)]Please register for PREMIUM VERSION HERE to read full post below containing analysis. In case of any error or you think you are not able to read the full post below, please email us at support#nehcap.com [lwa][/s2If] [s2If current_user_can(access_s2member_level4)]
- AUD/USD struggles to preserve its modest intraday gains amid broad-based USD strength.
- Bets for smaller Fed rate hikes and declining US bond yields might cap gains for the buck.
- Odds for an additional rate hike by the RBA should help limit the downside for the major.
- Traders now look forward to important US macro releases for some meaningful impetus.
The pair currently trades last at 0.69920.
The previous day high was 0.6997 while the previous day low was 0.693. The daily 38.2% Fib levels comes at 0.6971, expected to provide support. Similarly, the daily 61.8% fib level is at 0.6956, expected to provide support.
The AUD/USD pair continues with its struggle to find acceptance above the 0.7000 psychological mark and surrenders its modest intraday gains registered during the Asian session. Spot prices retreat to the lower end of the daily range, around the 0.6980-0.6975 region, and remain at the mercy of the US Dollar price dynamics.
Following a brief consolidation, the USD catches aggressive bids in reaction to the Bank of Japan-led sell-off in the Japanese Yen. Apart from this, the cautious market mood – amid growing worries about a deeper global economic downturn – further benefits the greenback’s relative safe-haven status and acts as a headwind for the risk-sensitive Aussie. That said, a combination of factors should help limit any meaningful corrective decline for the AUD/USD pair, at least for the time being.
Investors seem convinced that the Fed will soften its hawkish stance in the wake of easing inflationary pressures. In fact, the markets are currently pricing in a greater chance of a smaller 25 bps Fed rate hike move in February. This leads to a fresh leg down in the US Treasury bond yields, which might hold back the USD bulls from placing aggressive bets and lend some support to the AUD/USD pair. Furthermore, optimism over a Chinese economic recovery could underpin the China-proxy Aussie.
Apart from this, rising odds for an additional interest rate hike by the Reserve Bank of Australia (RBA) in February support prospects for the emergence of some dip-buying around the AUD/USD pair. This makes it prudent to wait for strong follow-through selling before confirming that spot prices have topped out and positioning for any meaningful corrective pullback. Traders now look forward to important US macro releases for a fresh impetus later during the early North American session.
Wednesday’s US economic docket features the release of the Producer Price Index (PPI) and monthly Retail Sales figures. This, along with the US bond yields and the broader risk sentiment, will drive the USD demand and allow traders to grab short-term opportunities around the AUD/USD pair. The focus will then shift to the Australian employment details, scheduled during the Asian session on Thursday.
Technical Levels: Supports and Resistances
AUDUSD currently trading at 0.6987 at the time of writing. Pair opened at 0.6986 and is trading with a change of 0.01 % .
| Overview | Overview.1 | |
|---|---|---|
| 0 | Today last price | 0.6987 |
| 1 | Today Daily Change | 0.0001 |
| 2 | Today Daily Change % | 0.0100 |
| 3 | Today daily open | 0.6986 |
The pair remains strongly bullish on the daily timeframe. It trades above its 20 SMA @ 0.6823, 50 SMA 0.6758, 100 SMA @ 0.6637 and 200 SMA @ 0.6827.
| Trends | Trends.1 | |
|---|---|---|
| 0 | Daily SMA20 | 0.6823 |
| 1 | Daily SMA50 | 0.6758 |
| 2 | Daily SMA100 | 0.6637 |
| 3 | Daily SMA200 | 0.6827 |
The previous day high was 0.6997 while the previous day low was 0.693. The daily 38.2% Fib levels comes at 0.6971, expected to provide support. Similarly, the daily 61.8% fib level is at 0.6956, expected to provide support.
Note the levels of interest below:
- Pivot support is noted at 0.6945, 0.6904, 0.6877
- Pivot resistance is noted at 0.7012, 0.7038, 0.708
| Levels | Levels.1 |
|---|---|
| Previous Daily High | 0.6997 |
| Previous Daily Low | 0.6930 |
| Previous Weekly High | 0.6994 |
| Previous Weekly Low | 0.6860 |
| Previous Monthly High | 0.6893 |
| Previous Monthly Low | 0.6629 |
| Daily Fibonacci 38.2% | 0.6971 |
| Daily Fibonacci 61.8% | 0.6956 |
| Daily Pivot Point S1 | 0.6945 |
| Daily Pivot Point S2 | 0.6904 |
| Daily Pivot Point S3 | 0.6877 |
| Daily Pivot Point R1 | 0.7012 |
| Daily Pivot Point R2 | 0.7038 |
| Daily Pivot Point R3 | 0.7080 |
[/s2If]
Join Our Telegram Group
")


