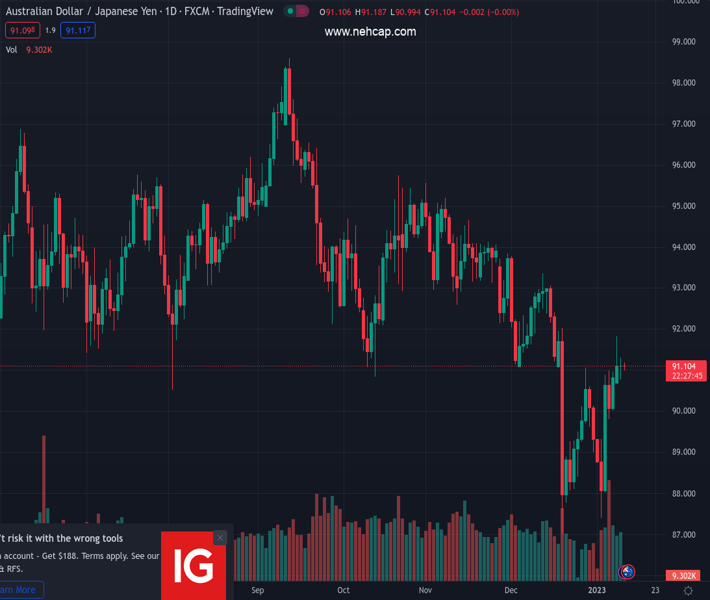
#AUDJPY @ 91.0980 formed a doji in the daily chart, suggesting buyers lost momentum. (Pivot Orderbook analysis)
…
This is a premium post.
[s2If !current_user_can(access_s2member_level4)]Please register for PREMIUM VERSION HERE to read full post below containing analysis. In case of any error or you think you are not able to read the full post below, please email us at support#nehcap.com [lwa][/s2If] [s2If current_user_can(access_s2member_level4)]
- AUD/JPY formed a doji in the daily chart, suggesting buyers lost momentum.
- The confluence of the 200-DMA and the 100-DMA, around 91.55/65, stalled the AUD/JPY uptrend.
- AUD/JPY double bottom is still in play, at risk of invalidation if the cross drops below 91.00.
The pair currently trades last at 91.0980.
The previous day high was 91.82 while the previous day low was 90.75. The daily 38.2% Fib levels comes at 91.41, expected to provide resistance. Similarly, the daily 61.8% fib level is at 91.16, expected to provide resistance.
After printing a doji on Tuesday, the AUD/JPY registers minuscule gains of 0.03% as Wednesday’s Asian session begins, though it remains around Tuesday’s close of 91.10. At the time of writing, the AUD/JPY is trading at 91.13.
The AUD/JPY failed to crack the 200-day Exponential Moving Average (EMA) at 91.65 for two consecutive days and, after printing a weekly high of 91.82 on Monday, slid toward the 91.10s area. Tuesday’s price action formed a doji, usually a bearish signal, which could open the door for a test of the 20-day EMA in the near term.
AUD/JPY traders should know that the double bottom remains in play. However, a fall below the December 28 daily high of 91.05 could invalidate the chart pattern.
AUD/JPY support rests at 91.05. A break / close below the latter will expose the 20-day EMA at 90.54, followed by last Friday’s swing low of 90.01.
As an alternate scenario, the Relative Strength Index (RSI) and the Rate of Change (RoC) suggest some buying pressure is building. Therefore, the AUD/JPY resistance levels lie at the 200-day EMA at 91.65, followed by the 92.00 figure and the December 13 daily high of 93.35.
Technical Levels: Supports and Resistances
AUDJPY currently trading at 91.18 at the time of writing. Pair opened at 91.11 and is trading with a change of 0.08 % .
| Overview | Overview.1 | |
|---|---|---|
| 0 | Today last price | 91.18 |
| 1 | Today Daily Change | 0.07 |
| 2 | Today Daily Change % | 0.08 |
| 3 | Today daily open | 91.11 |
The pair is trading above its 20 Daily moving average @ 90.23, below its 50 Daily moving average @ 92.12 , below its 100 Daily moving average @ 93.4 and below its 200 Daily moving average @ 93.24
| Trends | Trends.1 | |
|---|---|---|
| 0 | Daily SMA20 | 90.23 |
| 1 | Daily SMA50 | 92.12 |
| 2 | Daily SMA100 | 93.40 |
| 3 | Daily SMA200 | 93.24 |
The previous day high was 91.82 while the previous day low was 90.75. The daily 38.2% Fib levels comes at 91.41, expected to provide resistance. Similarly, the daily 61.8% fib level is at 91.16, expected to provide resistance.
Note the levels of interest below:
- Pivot support is noted at 90.63, 90.15, 89.55
- Pivot resistance is noted at 91.7, 92.3, 92.78
| Levels | Levels.1 |
|---|---|
| Previous Daily High | 91.82 |
| Previous Daily Low | 90.75 |
| Previous Weekly High | 90.99 |
| Previous Weekly Low | 87.41 |
| Previous Monthly High | 93.81 |
| Previous Monthly Low | 87.02 |
| Daily Fibonacci 38.2% | 91.41 |
| Daily Fibonacci 61.8% | 91.16 |
| Daily Pivot Point S1 | 90.63 |
| Daily Pivot Point S2 | 90.15 |
| Daily Pivot Point S3 | 89.55 |
| Daily Pivot Point R1 | 91.70 |
| Daily Pivot Point R2 | 92.30 |
| Daily Pivot Point R3 | 92.78 |
[/s2If]
Join Our Telegram Group


