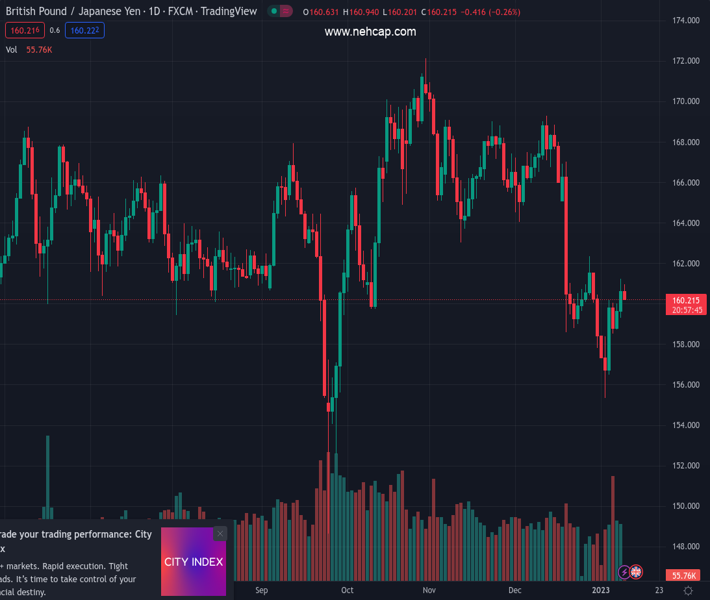
#GBPJPY @ 160.297 prints three-day uptrend as buyers keep the reins around one-week top., @nehcap view: Further upside expected (Pivot Orderbook analysis)
…
This is a premium post.
[s2If !current_user_can(access_s2member_level4)]Please register for PREMIUM VERSION HERE to read full post below containing analysis. In case of any error or you think you are not able to read the full post below, please email us at support#nehcap.com [lwa][/s2If] [s2If current_user_can(access_s2member_level4)]
- GBP/JPY prints three-day uptrend as buyers keep the reins around one-week top.
- Convergence of 21-day EMA, fortnight-old descending trend line challenges short-term bulls.
- 200-day EMA appears crucial for determining further upside, MACD flashes strongest bullish signals in two months.
The pair currently trades last at 160.297.
The previous day high was 161.24 while the previous day low was 159.32. The daily 38.2% Fib levels comes at 160.51, expected to provide resistance. Similarly, the daily 61.8% fib level is at 160.05, expected to provide support.
GBP/JPY picks up bids to renew intraday high near 160.90 during early Tuesday. In doing so, the cross-currency pair rises for the third consecutive day while reversing the previous day’s pullback from a one-week high.
The quote’s latest run-up could be linked to the strongest bullish MACD signals in nearly two months, as well as a successful rebound from horizontal support comprising multiple lows marked since late September.
Given the GBP/JPY pair’s ability to cross the 50% Fibonacci retracement level of September-October upside, the buyers are well set to battle with the 161.30 resistance confluence encompassing a two-week-old descending trend line and the 21-day Exponential Moving Average (EMA).
However, the pair’s further upside hinges on its ability to cross the 200-day EMA level of 162.55.
Also acting as an upside filter is the November 2022 low near 163.00, a break of which could direct GBP/JPY buyers toward the previous monthly high surrounding 169.30.
Alternatively, 50% and 61.8% Fibonacci retracement levels, respectively near 160.45 and 157.70, restrict short-term GBP/JPY downside.
Following that, the aforementioned horizontal support near 155.50 will be crucial for the bears to watch.
Trend: Further upside expected
Technical Levels: Supports and Resistances
GBPJPY currently trading at 160.93 at the time of writing. Pair opened at 160.54 and is trading with a change of 0.24% % .
| Overview | Overview.1 | |
|---|---|---|
| 0 | Today last price | 160.93 |
| 1 | Today Daily Change | 0.39 |
| 2 | Today Daily Change % | 0.24% |
| 3 | Today daily open | 160.54 |
The pair remains strongly bearish on the daily time frame. It trades below the 20 SMA @ 161.54, 50 SMA 164.71, 100 SMA @ 164.29 and 200 SMA @ 163.71.
| Trends | Trends.1 | |
|---|---|---|
| 0 | Daily SMA20 | 161.54 |
| 1 | Daily SMA50 | 164.71 |
| 2 | Daily SMA100 | 164.29 |
| 3 | Daily SMA200 | 163.71 |
The previous day high was 161.24 while the previous day low was 159.32. The daily 38.2% Fib levels comes at 160.51, expected to provide resistance. Similarly, the daily 61.8% fib level is at 160.05, expected to provide support.
Note the levels of interest below:
- Pivot support is noted at 159.49, 158.44, 157.56
- Pivot resistance is noted at 161.41, 162.29, 163.34
| Levels | Levels.1 |
|---|---|
| Previous Daily High | 161.24 |
| Previous Daily Low | 159.32 |
| Previous Weekly High | 160.18 |
| Previous Weekly Low | 155.36 |
| Previous Monthly High | 169.28 |
| Previous Monthly Low | 157.84 |
| Daily Fibonacci 38.2% | 160.51 |
| Daily Fibonacci 61.8% | 160.05 |
| Daily Pivot Point S1 | 159.49 |
| Daily Pivot Point S2 | 158.44 |
| Daily Pivot Point S3 | 157.56 |
| Daily Pivot Point R1 | 161.41 |
| Daily Pivot Point R2 | 162.29 |
| Daily Pivot Point R3 | 163.34 |
[/s2If]
Join Our Telegram Group
")


