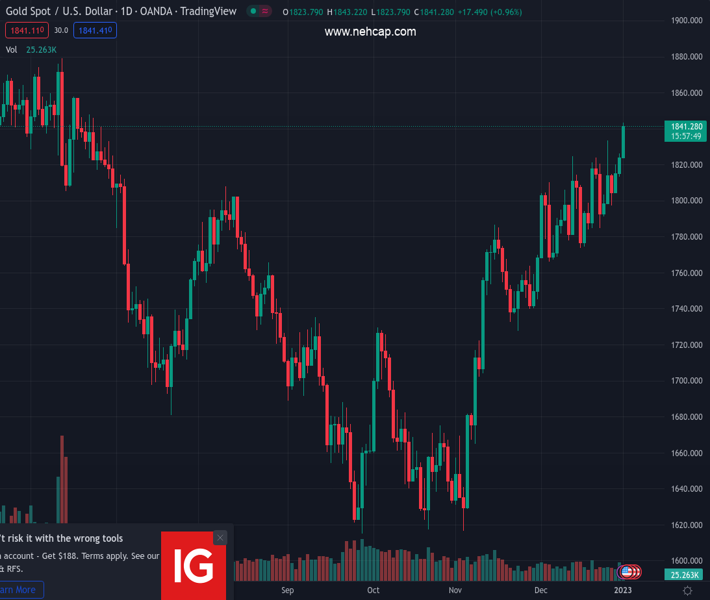
#XAUUSD @ 1,841.14 Gold price is looking to shift its business above $1,840.00 after an Ascending Triangle breakout. (Pivot Orderbook analysis)
…
This is a premium post.
[s2If !current_user_can(access_s2member_level4)]Please register for PREMIUM VERSION HERE to read full post below containing analysis. In case of any error or you think you are not able to read the full post below, please email us at support#nehcap.com [lwa][/s2If] [s2If current_user_can(access_s2member_level4)]
- Gold price is looking to shift its business above $1,840.00 after an Ascending Triangle breakout.
- The US Dollar Index has attempted a recovery after dropping to near 103.15.
- Higher interest rates by the Fed could be responsible for weaker consensus for US ISM PMI data.
The pair currently trades last at 1841.14.
The previous day high was 1823.76 while the previous day low was 1823.76. The daily 38.2% Fib levels comes at 1823.76, expected to provide support. Similarly, the daily 61.8% fib level is at 1823.76, expected to provide support.
Gold price (XAU/USD) has displayed a sheer north-side move after surpassing the critical resistance of $1,823.00 in the Asian session. The precious metal is aiming to shift its auction profile above the $1,840.00 resistance amid a decline in safe-haven’s appeal.
A sheer recovery move in the S&P500 futures has shifted the traction towards the risk appetite theme. Meanwhile, the US Dollar Index (DXY) has attempted a rebound after dropping to near the crucial support at 103.15. Investors should brace for volatility in the FX domain ahead of the release of Wednesday’s United States ISM Manufacturing PMI data (Dec). According to the estimates, the economic data will drop to 48.5 vs. the former release of 49.0.
The reasoning behind lower consensus for ISM PMI data could be the higher interest rates by the Federal Reserve (Fed) due to which firms have postponed their expansion plans to avoid higher interest obligations.
Apart from the Manufacturing PMI, the release of the Federal Open Market Committee (FOMC) minutes will hog the limelight. Investors will keenly observe the economic projections and cues about the monetary policy outlook for CY2023.
Gold price has delivered a breakout of the Ascending Triangle chart pattern formed on a four-hour scale. The horizontal resistance of the aforementioned chart pattern is placed from December 13 high at $1,824.55 while the upward-sloping trendline is plotted from December 16 low at $1,774.36.
Advancing 20-and 50-period Exponential Moving Averages (EMAs) at $1,820.00 and $1,812.07 respectively add to the upside filters.
Meanwhile, the Relative Strength Index (RSI) (14) has shifted into the bullish range of 60.00-80.00 from the 40.00-60.00 range, which indicates more upside ahead.
Technical Levels: Supports and Resistances
XAUUSD currently trading at 1838.21 at the time of writing. Pair opened at 1823.76 and is trading with a change of 0.79 % .
| Overview | Overview.1 | |
|---|---|---|
| 0 | Today last price | 1838.21 |
| 1 | Today Daily Change | 14.45 |
| 2 | Today Daily Change % | 0.79 |
| 3 | Today daily open | 1823.76 |
The pair remains strongly bullish on the daily timeframe. It trades above its 20 SMA @ 1799.73, 50 SMA 1753.32, 100 SMA @ 1723.46 and 200 SMA @ 1779.69.
| Trends | Trends.1 | |
|---|---|---|
| 0 | Daily SMA20 | 1799.73 |
| 1 | Daily SMA50 | 1753.32 |
| 2 | Daily SMA100 | 1723.46 |
| 3 | Daily SMA200 | 1779.69 |
The previous day high was 1823.76 while the previous day low was 1823.76. The daily 38.2% Fib levels comes at 1823.76, expected to provide support. Similarly, the daily 61.8% fib level is at 1823.76, expected to provide support.
Note the levels of interest below:
- Pivot support is noted at 1823.76, 1823.76, 1823.76
- Pivot resistance is noted at 1823.76, 1823.76, 1823.76
| Levels | Levels.1 |
|---|---|
| Previous Daily High | 1823.76 |
| Previous Daily Low | 1823.76 |
| Previous Weekly High | 1833.38 |
| Previous Weekly Low | 1797.11 |
| Previous Monthly High | 1833.38 |
| Previous Monthly Low | 1765.89 |
| Daily Fibonacci 38.2% | 1823.76 |
| Daily Fibonacci 61.8% | 1823.76 |
| Daily Pivot Point S1 | 1823.76 |
| Daily Pivot Point S2 | 1823.76 |
| Daily Pivot Point S3 | 1823.76 |
| Daily Pivot Point R1 | 1823.76 |
| Daily Pivot Point R2 | 1823.76 |
| Daily Pivot Point R3 | 1823.76 |
[/s2If]
Join Our Telegram Group
")


