#AUDUSD @ 0.68020 is looking for an immediate cushion around 0.6800 ahead of Caixin Manufacturing PMI data. (Pivot Orderbook analysis)
…
This is a premium post.
[s2If !current_user_can(access_s2member_level4)]Please register for PREMIUM VERSION HERE to read full post below containing analysis. In case of any error or you think you are not able to read the full post below, please email us at support#nehcap.com [lwa][/s2If] [s2If current_user_can(access_s2member_level4)]
- AUD/USD is looking for an immediate cushion around 0.6800 ahead of Caixin Manufacturing PMI data.
- After scrutiny of the Chinese official PMI and consensus, Caixin Manufacturing PMI is likely to remain downbeat.
- This week, the spotlight will remain on the release of the FOMC minutes.
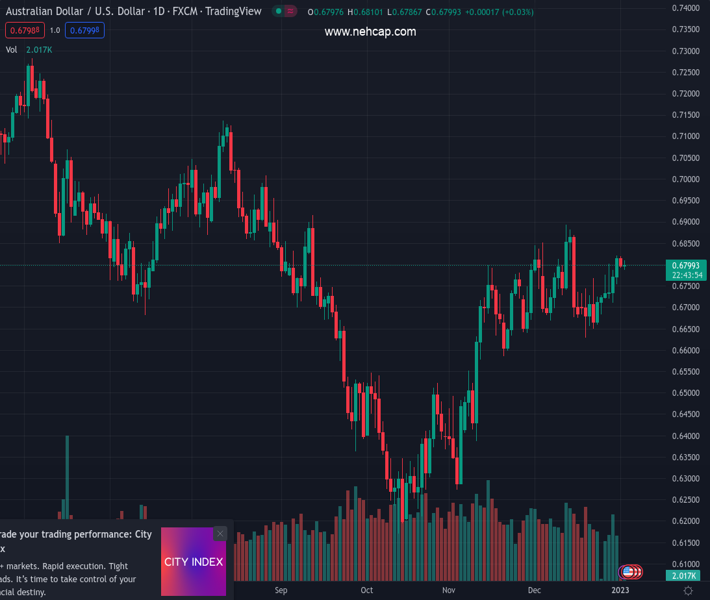
The pair currently trades last at 0.68020.
The previous day high was 0.6821 while the previous day low was 0.6753. The daily 38.2% Fib levels comes at 0.6795, expected to provide support. Similarly, the daily 61.8% fib level is at 0.6779, expected to provide support.
The AUD/USD pair is looking for demand after dropping to near the round-level support of 0.6800 in the early Asian session. The Aussie asset is displaying some volatility after the release of the S&P Global Manufacturing PMI data. The economic data has dropped to 50.2 vs. the consensus and the prior release of 50.4.
The US Dollar Index (DXY) has yet to return to active mode after the long-truncated week. However, Friday’s action is telling a detailed story. After a consolidation for 15 trading sessions, the USD Index delivered a downside break of the consolidation formed in a range of 103.46-104.57. Carry-forwarded price action on Tuesday might bring more pain to the US Dollar.
Going forward, the Australian Dollar is likely to display sheer volatility due to the release of the Caixin Manufacturing PMI data. The expression from consensus indicates a decline in the Manufacturing PMI to 48.8 vs. the former release of 49.4. Also, the observation from the reading of official Chinese Manufacturing PMI data indicates a decline in the extent of manufacturing activities. Official China’s Manufacturing PMI data dropped to 47.0 vs. the expectations of 49.2 and the former release of 48.0.
A decline in the extent of Manufacturing PMI in China could be the outcome of a spike in Covid-19 cases after reopening measures taken by the Chinese administration to put the economy back on track. It is worth noting that Australia is a leading trading partner of China and a higher-than-anticipated PMI might support the Australian Dollar.
On the United States front, investors will keep an eye on the release of Thursday’s Federal Open Market Committee (FOMC) minutes. The minutes from December’s monetary policy by the Federal Reserve (Fed) will provide a detailed explanation behind hiking interest rates by 50 basis points (bps).
Technical Levels: Supports and Resistances
AUDUSD currently trading at 0.6798 at the time of writing. Pair opened at 0.6808 and is trading with a change of -0.15 % .
| Overview | Overview.1 | |
|---|---|---|
| 0 | Today last price | 0.6798 |
| 1 | Today Daily Change | -0.0010 |
| 2 | Today Daily Change % | -0.1500 |
| 3 | Today daily open | 0.6808 |
The pair is trading above its 20 Daily moving average @ 0.6738, above its 50 Daily moving average @ 0.6645 , above its 100 Daily moving average @ 0.6642 and below its 200 Daily moving average @ 0.6863
| Trends | Trends.1 | |
|---|---|---|
| 0 | Daily SMA20 | 0.6738 |
| 1 | Daily SMA50 | 0.6645 |
| 2 | Daily SMA100 | 0.6642 |
| 3 | Daily SMA200 | 0.6863 |
The previous day high was 0.6821 while the previous day low was 0.6753. The daily 38.2% Fib levels comes at 0.6795, expected to provide support. Similarly, the daily 61.8% fib level is at 0.6779, expected to provide support.
Note the levels of interest below:
- Pivot support is noted at 0.6767, 0.6726, 0.6698
- Pivot resistance is noted at 0.6835, 0.6863, 0.6904
| Levels | Levels.1 |
|---|---|
| Previous Daily High | 0.6821 |
| Previous Daily Low | 0.6753 |
| Previous Weekly High | 0.6821 |
| Previous Weekly Low | 0.6710 |
| Previous Monthly High | 0.6893 |
| Previous Monthly Low | 0.6629 |
| Daily Fibonacci 38.2% | 0.6795 |
| Daily Fibonacci 61.8% | 0.6779 |
| Daily Pivot Point S1 | 0.6767 |
| Daily Pivot Point S2 | 0.6726 |
| Daily Pivot Point S3 | 0.6698 |
| Daily Pivot Point R1 | 0.6835 |
| Daily Pivot Point R2 | 0.6863 |
| Daily Pivot Point R3 | 0.6904 |
[/s2If]
Join Our Telegram Group
")


