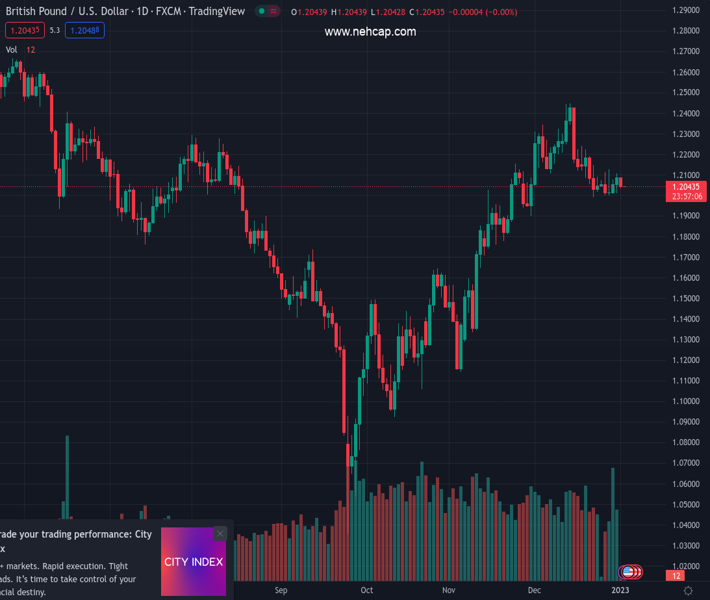
#GBPUSD @ 1.20460 is displaying a sideways auction below 1.2050 amid the festive market mood. (Pivot Orderbook analysis)
…
This is a premium post.
[s2If !current_user_can(access_s2member_level4)]Please register for PREMIUM VERSION HERE to read full post below containing analysis. In case of any error or you think you are not able to read the full post below, please email us at support#nehcap.com [lwa][/s2If] [s2If current_user_can(access_s2member_level4)]
- GBP/USD is displaying a sideways auction below 1.2050 amid the festive market mood.
- This week, the US ISM Manufacturing PMI data will be of utmost importance.
- Economists at ANZ Bank expect a continuation of pain for the Pound Sterling in CY2023.
The pair currently trades last at 1.20460.
The previous day high was 1.2108 while the previous day low was 1.201. The daily 38.2% Fib levels comes at 1.207, expected to provide resistance. Similarly, the daily 61.8% fib level is at 1.2047, expected to provide resistance.
The GBP/USD pair is displaying back-and-forth moves in a narrow range below the critical resistance of 1.2050 in the early Asian session. The Cable is expected to get back in action after a potential trigger as the market participants are still in a festive mood post-New Year celebrations.
It is critical to observe the risk profile for now as the action part is missing from the market after a holiday-truncated week. The majority of the western markets remained closed on Monday as investors were welcoming CY2023 for better prospects. The US Dollar Index (DXY) is yet to come into action mode and may display a healthy decline if it carry-forward Friday’s action.
The USD Index delivered a downside break of the consolidation formed in a range of 103.47-104.57 for the past week. The commentary from International Monetary Fund (IMF) could trigger volatility in the US Dollar. Managing Director Kristalina Georgieva of the IMF cited on the CBS Sunday morning news program that “For much of the global economy, 2023 is going to be a tough year as the main engines of global growth – the United States, Europe, and China – all may experience weakening activity,”.
This week, investors will keep an eye on the United States ISM Manufacturing PMI data, which will release on Wednesday. As per the consensus, the ISM Manufacturing data will escalate to 49.6 vs. the former release of 49.0. Apart from that, investors will keep New Orders Index on the radar, which might climb to 48.1 against the prior release of 47.2.
Meanwhile, economists at ANZ Bank expect a continuation of pain for the Pound Sterling in CY2023. A note from ANZ Bank states that “The fundamental backdrop for the United Kingdom is filled with uncertainty. Over the short term, households will have to deal with elevated inflation, higher taxes, and the increased costs of servicing debt. This will dent consumption and dampen the already subdued growth outlook. All of these are GBP negative.”
Technical Levels: Supports and Resistances
GBPUSD currently trading at 1.2048 at the time of writing. Pair opened at 1.209 and is trading with a change of -0.35 % .
| Overview | Overview.1 | |
|---|---|---|
| 0 | Today last price | 1.2048 |
| 1 | Today Daily Change | -0.0042 |
| 2 | Today Daily Change % | -0.3500 |
| 3 | Today daily open | 1.2090 |
The pair is trading below its 20 Daily moving average @ 1.2158, above its 50 Daily moving average @ 1.1906 , above its 100 Daily moving average @ 1.1667 and above its 200 Daily moving average @ 1.2046
| Trends | Trends.1 | |
|---|---|---|
| 0 | Daily SMA20 | 1.2158 |
| 1 | Daily SMA50 | 1.1906 |
| 2 | Daily SMA100 | 1.1667 |
| 3 | Daily SMA200 | 1.2046 |
The previous day high was 1.2108 while the previous day low was 1.201. The daily 38.2% Fib levels comes at 1.207, expected to provide resistance. Similarly, the daily 61.8% fib level is at 1.2047, expected to provide resistance.
Note the levels of interest below:
- Pivot support is noted at 1.203, 1.1971, 1.1933
- Pivot resistance is noted at 1.2128, 1.2167, 1.2226
| Levels | Levels.1 |
|---|---|
| Previous Daily High | 1.2108 |
| Previous Daily Low | 1.2010 |
| Previous Weekly High | 1.2126 |
| Previous Weekly Low | 1.2002 |
| Previous Monthly High | 1.2447 |
| Previous Monthly Low | 1.1992 |
| Daily Fibonacci 38.2% | 1.2070 |
| Daily Fibonacci 61.8% | 1.2047 |
| Daily Pivot Point S1 | 1.2030 |
| Daily Pivot Point S2 | 1.1971 |
| Daily Pivot Point S3 | 1.1933 |
| Daily Pivot Point R1 | 1.2128 |
| Daily Pivot Point R2 | 1.2167 |
| Daily Pivot Point R3 | 1.2226 |
[/s2If]
Join Our Telegram Group
")


