#GBPUSD @ 1.20720 fades bounce off the five-week-old support line, mildly offered of late., @nehcap view: Limited downside expected (Pivot Orderbook analysis)
…
This is a premium post.
[s2If !current_user_can(access_s2member_level4)]Please register for PREMIUM VERSION HERE to read full post below containing analysis. In case of any error or you think you are not able to read the full post below, please email us at support#nehcap.com [lwa][/s2If] [s2If current_user_can(access_s2member_level4)]
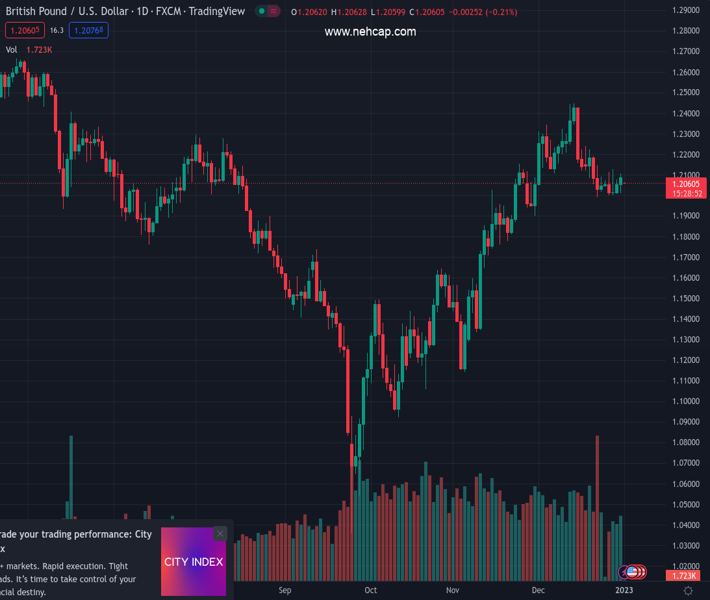
- GBP/USD fades bounce off the five-week-old support line, mildly offered of late.
- Bearish MACD signals suggest another attempt to break short-term support.
- Monthly horizontal resistance, December’s peak adds to the upside barriers.
The pair currently trades last at 1.20720.
The previous day high was 1.2108 while the previous day low was 1.201. The daily 38.2% Fib levels comes at 1.207, expected to provide support. Similarly, the daily 61.8% fib level is at 1.2047, expected to provide support.
GBP/USD renews its intraday low near 1.2070 during the first loss-making day in three, despite the market’s inaction during early Monday.
In doing so, the Cable pair takes a U-turn from the 200-day Exponential Moving Average (EMA) to recall the bears. Also keeping the GBP/USD sellers hopeful are the bearish MACD signals,
It’s worth noting, however, that a one-month-old ascending support line, close to 1.2020 by the press time, restricts short-term GBP/USD downside.
Following that, the late November swing low near 1.1900 could act as the last defense of the GBP/USD.
In a case where GBP/USD remains bearish past 1.1900, the odds of witnessing a slump towards the 38.2% Fibonacci retracement level of September-December 2022 upside, near 1.1650, can’t be ruled out.
Alternatively, a clear upside break of the 200-day EMA level surrounding 1.2115 could propel GBP/USD towards a one-month-long resistance line, close to 1.2355 at the latest.
Should the GBP/USD bulls occupy the driver’s seat past 1.2355, the previous monthly peak surrounding 1.2450 should gain the market’s attention.
Overall, GBP/USD is likely to witness a downside but the room towards the south appears limited.
Trend: Limited downside expected
Technical Levels: Supports and Resistances
GBPUSD currently trading at 1.2069 at the time of writing. Pair opened at 1.209 and is trading with a change of -0.17% % .
| Overview | Overview.1 | |
|---|---|---|
| 0 | Today last price | 1.2069 |
| 1 | Today Daily Change | -0.0021 |
| 2 | Today Daily Change % | -0.17% |
| 3 | Today daily open | 1.209 |
The pair is trading below its 20 Daily moving average @ 1.2158, above its 50 Daily moving average @ 1.1906 , above its 100 Daily moving average @ 1.1667 and above its 200 Daily moving average @ 1.2046
| Trends | Trends.1 | |
|---|---|---|
| 0 | Daily SMA20 | 1.2158 |
| 1 | Daily SMA50 | 1.1906 |
| 2 | Daily SMA100 | 1.1667 |
| 3 | Daily SMA200 | 1.2046 |
The previous day high was 1.2108 while the previous day low was 1.201. The daily 38.2% Fib levels comes at 1.207, expected to provide support. Similarly, the daily 61.8% fib level is at 1.2047, expected to provide support.
Note the levels of interest below:
- Pivot support is noted at 1.203, 1.1971, 1.1933
- Pivot resistance is noted at 1.2128, 1.2167, 1.2226
| Levels | Levels.1 |
|---|---|
| Previous Daily High | 1.2108 |
| Previous Daily Low | 1.2010 |
| Previous Weekly High | 1.2126 |
| Previous Weekly Low | 1.2002 |
| Previous Monthly High | 1.2447 |
| Previous Monthly Low | 1.1992 |
| Daily Fibonacci 38.2% | 1.2070 |
| Daily Fibonacci 61.8% | 1.2047 |
| Daily Pivot Point S1 | 1.2030 |
| Daily Pivot Point S2 | 1.1971 |
| Daily Pivot Point S3 | 1.1933 |
| Daily Pivot Point R1 | 1.2128 |
| Daily Pivot Point R2 | 1.2167 |
| Daily Pivot Point R3 | 1.2226 |
[/s2If]
Join Our Telegram Group
")


