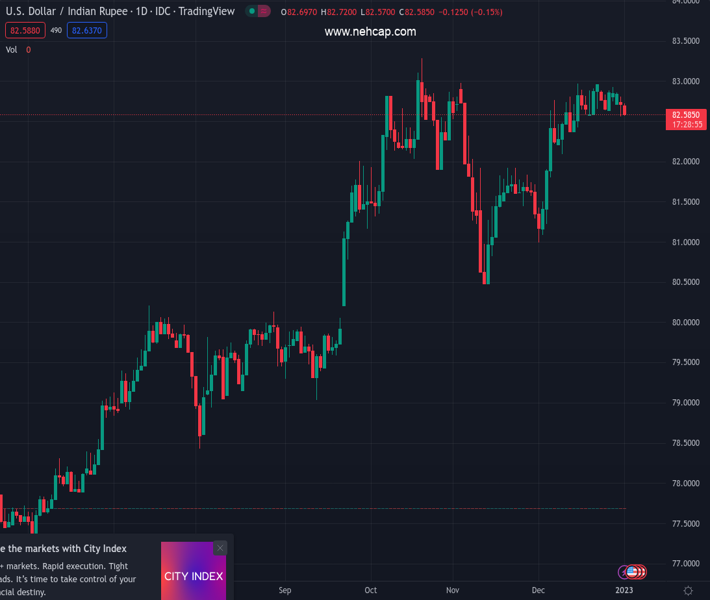
#USDINR @ 82.6050 is oscillating in a tight range for the past two weeks amid the absence of potential triggers. (Pivot Orderbook analysis)
…
This is a premium post.
[s2If !current_user_can(access_s2member_level4)]Please register for PREMIUM VERSION HERE to read full post below containing analysis. In case of any error or you think you are not able to read the full post below, please email us at support#nehcap.com [lwa][/s2If] [s2If current_user_can(access_s2member_level4)]
- USD/INR is oscillating in a tight range for the past two weeks amid the absence of potential triggers.
- The 20-and 50-EMAs are on the verge of delivering a bearish crossover around 82.37.
- A break inside the bearish range by the RSI (14) will activate bearish momentum.
The pair currently trades last at 82.6050.
The previous day high was 82.8969 while the previous day low was 82.5361. The daily 38.2% Fib levels comes at 82.6739, expected to provide resistance. Similarly, the daily 61.8% fib level is at 82.7591, expected to provide resistance.
The USD/INR pair is displaying some volatility in its opening trade on Monday after the festive mood. The asset is oscillating in the midst of the two-week-long trading range and is likely to continue further as the market participants seem still busy enjoying New Year celebrations.
Meanwhile, the US Dollar Index (DXY) dropped sharply to near 15-day low of around 103.00 on Friday amid a recovery in the risk-appetite theme. The 10-year US Treasury yields climbed to 3.88% amid obscurity in the overall risk theme.
On a four-hour scale, the Indian Rupee asset is oscillating in a range of 82.35-82.96 for the past two weeks. This could be termed as an inventory adjustment, however, it is difficult to tag it as an accumulation or a distribution.
The 20-and 50-period Exponential Moving Averages (EMAs) are on the verge of delivering a bearish crossover around 82.37, which might trigger a short-term downtrend.
While, the 200-EMA at 82.33 is sloping north, which indicates that the upside trend is still solid.
The Relative Strength Index (RSI) (14) is on the verge of delivering a break into the bearish range of 20.00-40.00, which might trigger a bearish momentum.
Should the asset break below December 13 low around 82.35, the Indian rupee bulls will drag the asset towards December 9 low around 82.00 followed by November 25 low at 81.42.
On the contrary, a breakout of the consolidation above the round-level resistance of 83.00 will expose the asset to hit its all-time high at 83.29. A breach of the latter will send the major into unchartered territory.
Technical Levels: Supports and Resistances
USDINR currently trading at 82.5825 at the time of writing. Pair opened at 82.7006 and is trading with a change of -0.14 % .
| Overview | Overview.1 | |
|---|---|---|
| 0 | Today last price | 82.5825 |
| 1 | Today Daily Change | -0.1181 |
| 2 | Today Daily Change % | -0.1400 |
| 3 | Today daily open | 82.7006 |
The pair is trading below its 20 Daily moving average @ 82.6056, above its 50 Daily moving average @ 82.1006 , above its 100 Daily moving average @ 81.4133 and above its 200 Daily moving average @ 79.634
| Trends | Trends.1 | |
|---|---|---|
| 0 | Daily SMA20 | 82.6056 |
| 1 | Daily SMA50 | 82.1006 |
| 2 | Daily SMA100 | 81.4133 |
| 3 | Daily SMA200 | 79.6340 |
The previous day high was 82.8969 while the previous day low was 82.5361. The daily 38.2% Fib levels comes at 82.6739, expected to provide resistance. Similarly, the daily 61.8% fib level is at 82.7591, expected to provide resistance.
Note the levels of interest below:
- Pivot support is noted at 82.5255, 82.3504, 82.1647
- Pivot resistance is noted at 82.8863, 83.072, 83.2471
| Levels | Levels.1 |
|---|---|
| Previous Daily High | 82.8969 |
| Previous Daily Low | 82.5361 |
| Previous Weekly High | 84.2500 |
| Previous Weekly Low | 82.4176 |
| Previous Monthly High | 84.2500 |
| Previous Monthly Low | 80.9855 |
| Daily Fibonacci 38.2% | 82.6739 |
| Daily Fibonacci 61.8% | 82.7591 |
| Daily Pivot Point S1 | 82.5255 |
| Daily Pivot Point S2 | 82.3504 |
| Daily Pivot Point S3 | 82.1647 |
| Daily Pivot Point R1 | 82.8863 |
| Daily Pivot Point R2 | 83.0720 |
| Daily Pivot Point R3 | 83.2471 |
[/s2If]
Join Our Telegram Group
")


