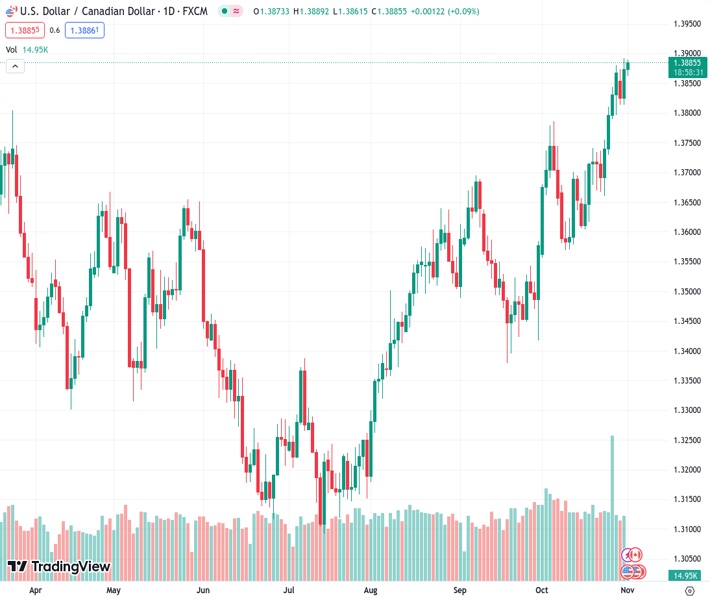
#USDCAD @ 1.38867 continues to draw support from bearish Oil prices and a modest USD strength.
…
This is a premium post.
[s2If !current_user_can(access_s2member_level4)]Please register for FREE REGISTER to read full post below containing analysis. In case of any error or you think you are not able to read the full post below, please email us at support#nehcap.com [lwa][/s2If] [s2If current_user_can(access_s2member_level1)]
- USD/CAD continues to draw support from bearish Oil prices and a modest USD strength.
The pair currently trades last at 1.38867.
The previous day high was 1.3892 while the previous day low was 1.3814. The daily 38.2% Fib levels comes at 1.3862, expected to provide support. Similarly, the daily 61.8% fib level is at 1.3844, expected to provide support.
The USD/CAD pair attracts some dip-buying during the Asian session on Wednesday and inches back closer to its highest level since October 2022 touched the previous day. Spot prices currently trade around the 1.3885 region and continue to draw support from a combination of factors.
Crude Oil prices languish near a two-month low despite worries that the ongoing conflict between Israel and Hamas could lead to a disruption in supply from the Middle East. Adding to this, the disappointing release of the monthly Canadian GDP print on Tuesday continues to undermine the commodity-linked Loonie and act as a tailwind for the USD/CAD pair. In fact, data published by Statistics Canada showed that the economy was effectively flat in August and the July GDP was revised down to show a marginal contraction as compared to a zero growth reported initially. Furthermore, the flash estimate indicated that the economy was likely also unchanged in September, which translates into an annualized 0.1% decline in the third quarter and confirms a technical recession.
Apart from this, a modest US Dollar (USD) strength turns out to be another factor lending support to the USD/CAD pair. The prospects for further policy tightening by the Federal Reserve (Fed) remain supportive of elevated US Treasury bond yields and continue to benefit the Greenback. The USD bulls, however, seem reluctant to place aggressive bets and now look to the outcome of the highly-anticipated FOMC meeting before placing fresh bets. The US central bank will announce its decision later during the US session and is expected to maintain the status quo for the second time in a row. Investors, however, seem convinced that the Fed will stick to its hawkish stance in the wake of the US economic resilience and keep the door open for one more rate hike in 2023 to combat sticky inflation.
Hence, market participants will closely scrutinize the accompanying monetary policy statement and Fed Chair Jerome Powell’s comments at the post-meeting press conference for cues about the future rate-hike path. This, in turn, will help determine the next leg of a directional move for the buck and provide some meaningful impetus to the USD/CAD pair. Heading into the key central bank event risk, traders will confront the release of important US macro data – the ADP report on private-sector employment, the ISM Manufacturing PMI and JOLTS Job Openings data – later during the early North American session. This, along with Oil price dynamics, should contribute to producing short-term trading opportunities around the major.
Technical Levels: Supports and Resistances
USDCAD currently trading at 1.3881 at the time of writing. Pair opened at 1.3875 and is trading with a change of 0.04 % .
| Overview | Overview.1 | |
|---|---|---|
| 0 | Today last price | 1.3881 |
| 1 | Today Daily Change | 0.0006 |
| 2 | Today Daily Change % | 0.0400 |
| 3 | Today daily open | 1.3875 |
The pair remains strongly bullish on the daily timeframe. It trades above its 20 SMA @ 1.3714, 50 SMA 1.3619, 100 SMA @ 1.3454 and 200 SMA @ 1.3485.
| Trends | Trends.1 | |
|---|---|---|
| 0 | Daily SMA20 | 1.3714 |
| 1 | Daily SMA50 | 1.3619 |
| 2 | Daily SMA100 | 1.3454 |
| 3 | Daily SMA200 | 1.3485 |
The previous day high was 1.3892 while the previous day low was 1.3814. The daily 38.2% Fib levels comes at 1.3862, expected to provide support. Similarly, the daily 61.8% fib level is at 1.3844, expected to provide support.
Note the levels of interest below:
- Pivot support is noted at 1.3828, 1.3782, 1.375
- Pivot resistance is noted at 1.3907, 1.3939, 1.3985
| Levels | Levels.1 |
|---|---|
| Previous Daily High | 1.3892 |
| Previous Daily Low | 1.3814 |
| Previous Weekly High | 1.3881 |
| Previous Weekly Low | 1.3661 |
| Previous Monthly High | 1.3892 |
| Previous Monthly Low | 1.3562 |
| Daily Fibonacci 38.2% | 1.3862 |
| Daily Fibonacci 61.8% | 1.3844 |
| Daily Pivot Point S1 | 1.3828 |
| Daily Pivot Point S2 | 1.3782 |
| Daily Pivot Point S3 | 1.3750 |
| Daily Pivot Point R1 | 1.3907 |
| Daily Pivot Point R2 | 1.3939 |
| Daily Pivot Point R3 | 1.3985 |
[/s2If]
Download Nehcap EAWe have two EAs that are operational on our LIVE accounts.
- EA-FIX: Check out the details here. Download EA-FIX . EA-FIX is a non-grid HFT scalper.
- EA-GROWTH: High quality low dd EA using trend grids. Download EA_GROWTHJoin Our Telegram Group
")


