#USDMXN @ 18.0715 rebounds after a losing streak.
…
This is a premium post.
[s2If !current_user_can(access_s2member_level4)]Please register for FREE REGISTER to read full post below containing analysis. In case of any error or you think you are not able to read the full post below, please email us at support#nehcap.com [lwa][/s2If] [s2If current_user_can(access_s2member_level1)]
- USD/MXN rebounds after a losing streak.
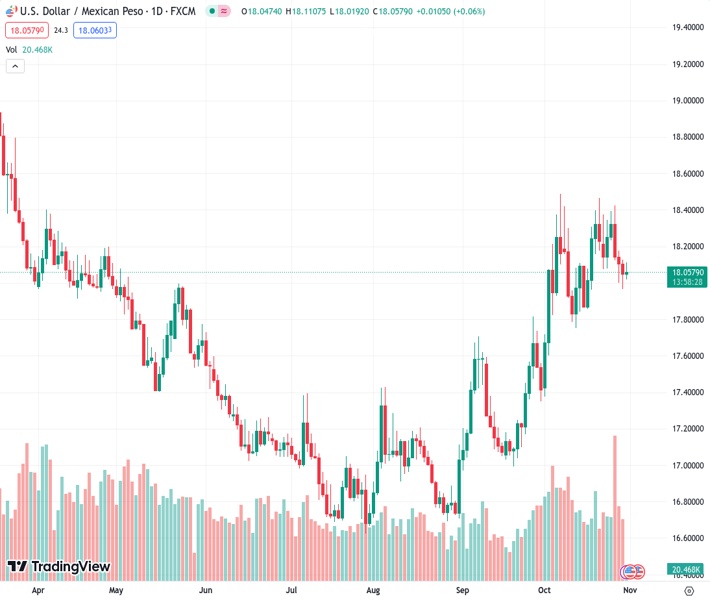
The pair currently trades last at 18.0715.
The previous day high was 18.141 while the previous day low was 17.9653. The daily 38.2% Fib levels comes at 18.0324, expected to provide support. Similarly, the daily 61.8% fib level is at 18.0739, expected to provide resistance.
USD/MXN snaps a three-day losing streak, trading higher around 18.0700 during the Asian session on Tuesday, followed by the key resistance around the seven-day Exponential Moving Average (EMA) at 18.1310 lined up with the key level at 18.2000.
A firm breakthrough above the barrier could open the doors for the USD/MXN pair to explore the region around the previous week’s low at 18.4257 in sync with the monthly low at 18.4945.
On the downside, the USD/MXN pair could receive support around the 23.6% Fibonacci retracement at 18.0526 lined up with the 18.0000 major level, followed by the weekly high at 17.9749.
The Moving Average Convergence Divergence (MACD) line remains above the centerline but diverges below the signal line, suggesting a potential shift in momentum. This divergence indicates that the recent upward momentum may be slowing down.
The 14-day Relative Strength Index (RSI) lies above the 50 level, indicating a bullish momentum in the market. This suggests that the recent gains in the USD/MXN pair have been stronger and the pair is overbought, implying strength in the current trend.
Technical Levels: Supports and Resistances
USDMXN currently trading at 18.0766 at the time of writing. Pair opened at 18.0492 and is trading with a change of 0.15 % .
| Overview | Overview.1 | |
|---|---|---|
| 0 | Today last price | 18.0766 |
| 1 | Today Daily Change | 0.0274 |
| 2 | Today Daily Change % | 0.1500 |
| 3 | Today daily open | 18.0492 |
The pair is trading below its 20 Daily moving average @ 18.1151, above its 50 Daily moving average @ 17.5651 , above its 100 Daily moving average @ 17.2941 and above its 200 Daily moving average @ 17.7302
| Trends | Trends.1 | |
|---|---|---|
| 0 | Daily SMA20 | 18.1151 |
| 1 | Daily SMA50 | 17.5651 |
| 2 | Daily SMA100 | 17.2941 |
| 3 | Daily SMA200 | 17.7302 |
The previous day high was 18.141 while the previous day low was 17.9653. The daily 38.2% Fib levels comes at 18.0324, expected to provide support. Similarly, the daily 61.8% fib level is at 18.0739, expected to provide resistance.
Note the levels of interest below:
- Pivot support is noted at 17.9627, 17.8762, 17.7871
- Pivot resistance is noted at 18.1384, 18.2275, 18.314
| Levels | Levels.1 |
|---|---|
| Previous Daily High | 18.1410 |
| Previous Daily Low | 17.9653 |
| Previous Weekly High | 18.4247 |
| Previous Weekly Low | 18.0002 |
| Previous Monthly High | 17.8174 |
| Previous Monthly Low | 16.9727 |
| Daily Fibonacci 38.2% | 18.0324 |
| Daily Fibonacci 61.8% | 18.0739 |
| Daily Pivot Point S1 | 17.9627 |
| Daily Pivot Point S2 | 17.8762 |
| Daily Pivot Point S3 | 17.7871 |
| Daily Pivot Point R1 | 18.1384 |
| Daily Pivot Point R2 | 18.2275 |
| Daily Pivot Point R3 | 18.3140 |
[/s2If]
Download Nehcap EAWe have two EAs that are operational on our LIVE accounts.
- EA-FIX: Check out the details here. Download EA-FIX . EA-FIX is a non-grid HFT scalper.
- EA-GROWTH: High quality low dd EA using trend grids. Download EA_GROWTHJoin Our Telegram Group
")


