#NZDJPY @ 87.9450 rose from daily lows of 87.03 to test 88.00, though the rally was halted by the Kijun-Sen at 88.49.
…
This is a premium post.
[s2If !current_user_can(access_s2member_level4)]Please register for FREE REGISTER to read full post below containing analysis. In case of any error or you think you are not able to read the full post below, please email us at support#nehcap.com [lwa][/s2If] [s2If current_user_can(access_s2member_level1)]
- NZD/JPY rose from daily lows of 87.03 to test 88.00, though the rally was halted by the Kijun-Sen at 88.49.
The pair currently trades last at 87.9450.
The previous day high was 87.42 while the previous day low was 86.84. The daily 38.2% Fib levels comes at 87.2, expected to provide support. Similarly, the daily 61.8% fib level is at 87.07, expected to provide support.
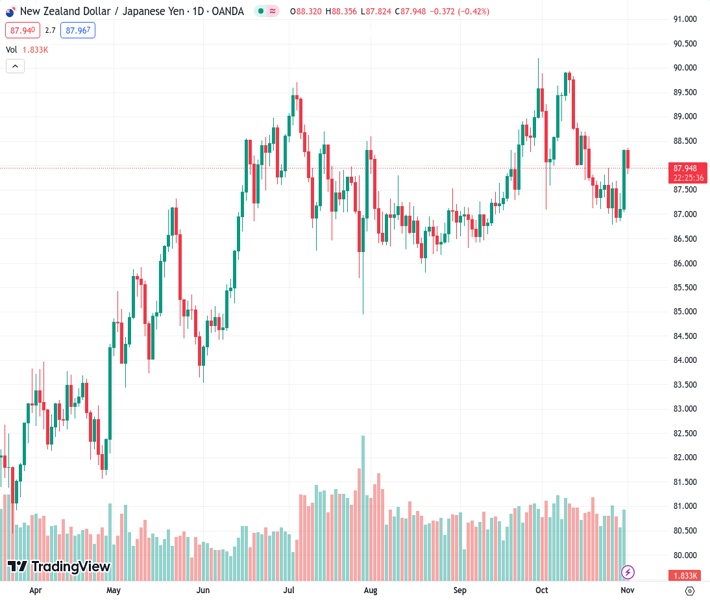
The NZD/JPY jumped from daily lows of 87.03, climbing past the 88.00 figure on Tuesday. However, the advancement was capped by the Kijun-Sen at 88.49, and a seven-month-old upslope support trendline turned resistance, which pushed prices toward the top of the Ichimoku Cloud (Kumo). The pair is trading at 87.89, down 0.48%.
The daily chart portrays the pair as neutral to downward biased, about to break inside the Kumo, which could pave the way for further downside. If NZD/JPY falls below the top of the Kumo at 87.82, that would drive the price towards the bottom of the Kumo at 87.00 before challenging the September 5 swing low of 86.30.
On the contrary, NZD/JPY buyers could remain hopeful if the pair climbs back above the 88.00 figure. A breach of the latter would expose the Kijun-Sen at 88.49, followed by 89.00. A decisive break would expose the October 11 high at 89.93.
Technical Levels: Supports and Resistances
NZDJPY currently trading at 87.94 at the time of writing. Pair opened at 87.11 and is trading with a change of 0.95 % .
| Overview | Overview.1 | |
|---|---|---|
| 0 | Today last price | 87.94 |
| 1 | Today Daily Change | 0.83 |
| 2 | Today Daily Change % | 0.95 |
| 3 | Today daily open | 87.11 |
The pair is trading below its 20 Daily moving average @ 88.18, above its 50 Daily moving average @ 87.73 , above its 100 Daily moving average @ 87.64 and above its 200 Daily moving average @ 85.73
| Trends | Trends.1 | |
|---|---|---|
| 0 | Daily SMA20 | 88.18 |
| 1 | Daily SMA50 | 87.73 |
| 2 | Daily SMA100 | 87.64 |
| 3 | Daily SMA200 | 85.73 |
The previous day high was 87.42 while the previous day low was 86.84. The daily 38.2% Fib levels comes at 87.2, expected to provide support. Similarly, the daily 61.8% fib level is at 87.07, expected to provide support.
Note the levels of interest below:
- Pivot support is noted at 86.83, 86.55, 86.25
- Pivot resistance is noted at 87.41, 87.7, 87.99
| Levels | Levels.1 |
|---|---|
| Previous Daily High | 87.42 |
| Previous Daily Low | 86.84 |
| Previous Weekly High | 87.95 |
| Previous Weekly Low | 86.78 |
| Previous Monthly High | 90.21 |
| Previous Monthly Low | 86.30 |
| Daily Fibonacci 38.2% | 87.20 |
| Daily Fibonacci 61.8% | 87.07 |
| Daily Pivot Point S1 | 86.83 |
| Daily Pivot Point S2 | 86.55 |
| Daily Pivot Point S3 | 86.25 |
| Daily Pivot Point R1 | 87.41 |
| Daily Pivot Point R2 | 87.70 |
| Daily Pivot Point R3 | 87.99 |
[/s2If]
Download Nehcap EAWe have two EAs that are operational on our LIVE accounts.
- EA-FIX: Check out the details here. Download EA-FIX . EA-FIX is a non-grid HFT scalper.
- EA-GROWTH: High quality low dd EA using trend grids. Download EA_GROWTHJoin Our Telegram Group
")


