#EURUSD @ 1.06094 Price Analysis: Immediately to the upside aligns 1.0700
…
This is a premium post.
[s2If !current_user_can(access_s2member_level4)]Please register for FREE REGISTER to read full post below containing analysis. In case of any error or you think you are not able to read the full post below, please email us at support#nehcap.com [lwa][/s2If] [s2If current_user_can(access_s2member_level1)]
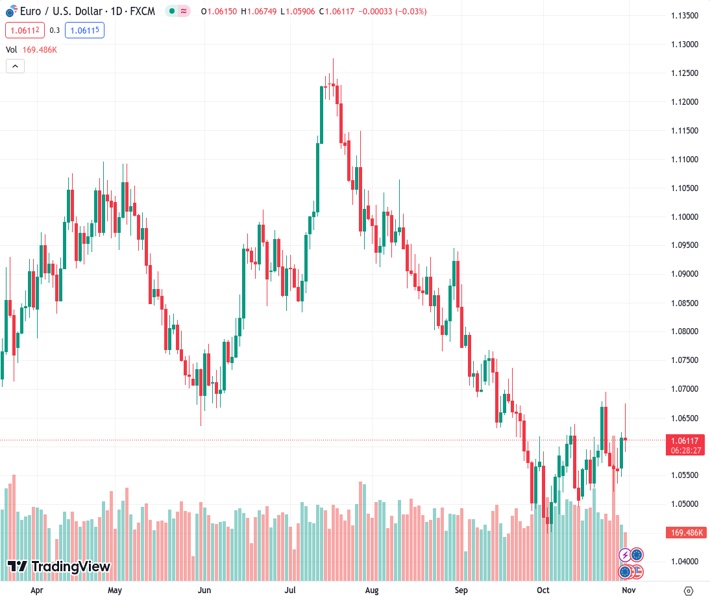
- The pair currently trades last at 1.06094.
- Pivot support is noted at 1.0567, 1.0518, 1.0489
- Pivot resistance is noted at 1.0644, 1.0674, 1.0722
- EA-FIX: Check out the details here. Download EA-FIX . EA-FIX is a non-grid HFT scalper.
- EA-GROWTH: High quality low dd EA using trend grids. Download EA_GROWTHJoin Our Telegram Group
The previous day high was 1.0625 while the previous day low was 1.0547. The daily 38.2% Fib levels comes at 1.0595, expected to provide support. Similarly, the daily 61.8% fib level is at 1.0577, expected to provide support.
– EUR/USD advances further and retests the 1.0670/75 band.
– Further gains could see the 1.0700 region revisited in the near term.
EUR/USD comes under some pressure soon after hitting multi-day highs around 1.0675 on Tuesday, a region where the interim 55-day SMA also sits.
In case bulls push harder, the pair should meet the next hurdle at the monthly high of 1.0694 (October 24), which comes just ahead of the round level of 1.0700 and prior to the weekly peaks of 1.0736 (September 20) and 1.0767 (September 12).
In the meantime, while below the 200-day SMA at 1.0809, the pair’s outlook should remain negative.
Technical Levels: Supports and Resistances
EURUSD currently trading at 1.0613 at the time of writing. Pair opened at 1.0615 and is trading with a change of -0.02 % .
| Overview | Overview.1 | |
|---|---|---|
| 0 | Today last price | 1.0613 |
| 1 | Today Daily Change | 84.0000 |
| 2 | Today Daily Change % | -0.0200 |
| 3 | Today daily open | 1.0615 |
The pair is trading above its 20 Daily moving average @ 1.0568, below its 50 Daily moving average @ 1.0654 , below its 100 Daily moving average @ 1.0817 and below its 200 Daily moving average @ 1.0812
| Trends | Trends.1 | |
|---|---|---|
| 0 | Daily SMA20 | 1.0568 |
| 1 | Daily SMA50 | 1.0654 |
| 2 | Daily SMA100 | 1.0817 |
| 3 | Daily SMA200 | 1.0812 |
The previous day high was 1.0625 while the previous day low was 1.0547. The daily 38.2% Fib levels comes at 1.0595, expected to provide support. Similarly, the daily 61.8% fib level is at 1.0577, expected to provide support.
Note the levels of interest below:
| Levels | Levels.1 |
|---|---|
| Previous Daily High | 1.0625 |
| Previous Daily Low | 1.0547 |
| Previous Weekly High | 1.0695 |
| Previous Weekly Low | 1.0522 |
| Previous Monthly High | 1.0882 |
| Previous Monthly Low | 1.0488 |
| Daily Fibonacci 38.2% | 1.0595 |
| Daily Fibonacci 61.8% | 1.0577 |
| Daily Pivot Point S1 | 1.0567 |
| Daily Pivot Point S2 | 1.0518 |
| Daily Pivot Point S3 | 1.0489 |
| Daily Pivot Point R1 | 1.0644 |
| Daily Pivot Point R2 | 1.0674 |
| Daily Pivot Point R3 | 1.0722 |
[/s2If]
Download Nehcap EAWe have two EAs that are operational on our LIVE accounts.
")


