#AUDJPY @ 94.9380 trades at 94.98, down 0.02%, after failing to sustain gains above 95.00.
…
This is a premium post.
[s2If !current_user_can(access_s2member_level4)]Please register for FREE REGISTER to read full post below containing analysis. In case of any error or you think you are not able to read the full post below, please email us at support#nehcap.com [lwa][/s2If] [s2If current_user_can(access_s2member_level1)]
- AUD/JPY trades at 94.98, down 0.02%, after failing to sustain gains above 95.00.
The pair currently trades last at 94.9380.
The previous day high was 95.37 while the previous day low was 94.68. The daily 38.2% Fib levels comes at 94.94, expected to provide resistance. Similarly, the daily 61.8% fib level is at 95.1, expected to provide resistance.
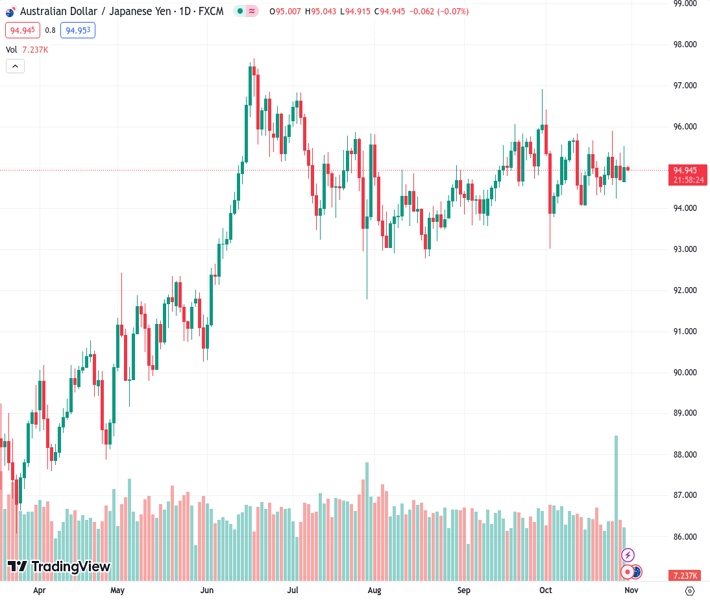
The AUD/JPY continues to consolidate at around 94.50/95.00 in early trading on Tuesday’s Asian session after failing to stay above the 95.00 figure on Monday. The cross-pair printed decent gains of 0.32% yesterday, but as the Asian session starts, the pair exchanges hands at 94.98, down 0.02%.
The daily chart portrays the pair remaining sideways, about to drop inside the Ichimoku Cloud (Kumo), which could open the door for further downside. The AUD/JPY first support would be the October 30 low of 94.65, followed by the 94.00 figure. Once that level is cleared, the next stop would be the base of the Kumo at 93.96, followed by the October 3 low of 93.01.
On the flip side, the AUD/JPY first resistance would be the 95.00 figure, followed by the current week’s high at 95.52. A decisive break would expose the October 25 95.89 mark, ahead of 96.00.
Technical Levels: Supports and Resistances
AUDJPY currently trading at 95.01 at the time of writing. Pair opened at 94.8 and is trading with a change of 0.22 % .
| Overview | Overview.1 | |
|---|---|---|
| 0 | Today last price | 95.01 |
| 1 | Today Daily Change | 0.21 |
| 2 | Today Daily Change % | 0.22 |
| 3 | Today daily open | 94.80 |
The pair remains strongly bullish on the daily timeframe. It trades above its 20 SMA @ 94.91, 50 SMA 94.77, 100 SMA @ 94.88 and 200 SMA @ 92.76.
| Trends | Trends.1 | |
|---|---|---|
| 0 | Daily SMA20 | 94.91 |
| 1 | Daily SMA50 | 94.77 |
| 2 | Daily SMA100 | 94.88 |
| 3 | Daily SMA200 | 92.76 |
The previous day high was 95.37 while the previous day low was 94.68. The daily 38.2% Fib levels comes at 94.94, expected to provide resistance. Similarly, the daily 61.8% fib level is at 95.1, expected to provide resistance.
Note the levels of interest below:
- Pivot support is noted at 94.53, 94.26, 93.84
- Pivot resistance is noted at 95.22, 95.64, 95.92
| Levels | Levels.1 |
|---|---|
| Previous Daily High | 95.37 |
| Previous Daily Low | 94.68 |
| Previous Weekly High | 95.90 |
| Previous Weekly Low | 94.25 |
| Previous Monthly High | 96.92 |
| Previous Monthly Low | 93.59 |
| Daily Fibonacci 38.2% | 94.94 |
| Daily Fibonacci 61.8% | 95.10 |
| Daily Pivot Point S1 | 94.53 |
| Daily Pivot Point S2 | 94.26 |
| Daily Pivot Point S3 | 93.84 |
| Daily Pivot Point R1 | 95.22 |
| Daily Pivot Point R2 | 95.64 |
| Daily Pivot Point R3 | 95.92 |
[/s2If]
Download Nehcap EAWe have two EAs that are operational on our LIVE accounts.
- EA-FIX: Check out the details here. Download EA-FIX . EA-FIX is a non-grid HFT scalper.
- EA-GROWTH: High quality low dd EA using trend grids. Download EA_GROWTHJoin Our Telegram Group
")


