#XAGUSD @ 23.116 Silver price jumps from $22.70 to $23.07, testing crucial resistance at 200-DMA of $23.26.
…
This is a premium post.
[s2If !current_user_can(access_s2member_level4)]Please register for FREE REGISTER to read full post below containing analysis. In case of any error or you think you are not able to read the full post below, please email us at support#nehcap.com [lwa][/s2If] [s2If current_user_can(access_s2member_level1)]
- Silver price jumps from $22.70 to $23.07, testing crucial resistance at 200-DMA of $23.26.
The pair currently trades last at 23.116.
The previous day high was 23.14 while the previous day low was 22.44. The daily 38.2% Fib levels comes at 22.71, expected to provide support. Similarly, the daily 61.8% fib level is at 22.88, expected to provide support.
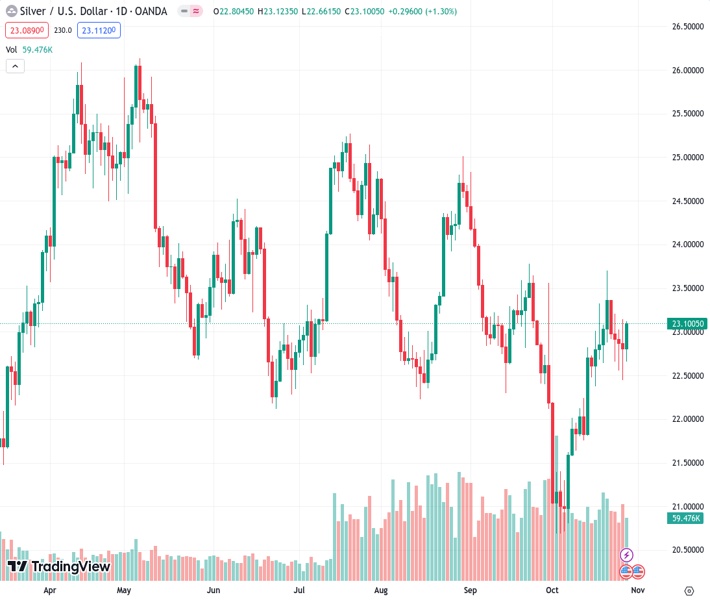
Silver price jumped above the $23.00 figure bolstered by a risk-off impulse, amidst geopolitical headlines suggesting the Middle East conflict is escalating, as Israel began its ground offensive at the Gaza strip. That said, the XAG/USD rose from $22.70 and is trading at $23.07, gaining more than 1.35%.
The XAG/USD remains downward biased despite rising above the 50-day moving average (DMA) at $22.94, about to test the crucial resistance level at the 200-DMA at $23.26. once that level is cruised, the next ceiling level would be $23.69, the latest cycle high. In a breach of that level, Silver bias would shift to neutral upwards, exposing the top of the Bollinger bands at $23.80,
Conversely, if Silver tumbles below $23.00, that would keep the downtrend in place. The first support would be the 50-DMA at $22.94, followed by the October 26 low of $22.44, before tumbling to challenge the 20-day Exponential Moving Average (EMA) at $22.25.
Technical Levels: Supports and Resistances
XAGUSD currently trading at 23.08 at the time of writing. Pair opened at 22.79 and is trading with a change of 1.27 % .
| Overview | Overview.1 | |
|---|---|---|
| 0 | Today last price | 23.08 |
| 1 | Today Daily Change | 0.29 |
| 2 | Today Daily Change % | 1.27 |
| 3 | Today daily open | 22.79 |
The pair is trading above its 20 Daily moving average @ 22.23, above its 50 Daily moving average @ 22.96 , below its 100 Daily moving average @ 23.26 and below its 200 Daily moving average @ 23.3
| Trends | Trends.1 | |
|---|---|---|
| 0 | Daily SMA20 | 22.23 |
| 1 | Daily SMA50 | 22.96 |
| 2 | Daily SMA100 | 23.26 |
| 3 | Daily SMA200 | 23.30 |
The previous day high was 23.14 while the previous day low was 22.44. The daily 38.2% Fib levels comes at 22.71, expected to provide support. Similarly, the daily 61.8% fib level is at 22.88, expected to provide support.
Note the levels of interest below:
- Pivot support is noted at 22.44, 22.1, 21.75
- Pivot resistance is noted at 23.14, 23.49, 23.84
| Levels | Levels.1 |
|---|---|
| Previous Daily High | 23.14 |
| Previous Daily Low | 22.44 |
| Previous Weekly High | 23.70 |
| Previous Weekly Low | 22.37 |
| Previous Monthly High | 24.82 |
| Previous Monthly Low | 22.12 |
| Daily Fibonacci 38.2% | 22.71 |
| Daily Fibonacci 61.8% | 22.88 |
| Daily Pivot Point S1 | 22.44 |
| Daily Pivot Point S2 | 22.10 |
| Daily Pivot Point S3 | 21.75 |
| Daily Pivot Point R1 | 23.14 |
| Daily Pivot Point R2 | 23.49 |
| Daily Pivot Point R3 | 23.84 |
[/s2If]
Download Nehcap EAWe have two EAs that are operational on our LIVE accounts.
- EA-FIX: Check out the details here. Download EA-FIX . EA-FIX is a non-grid HFT scalper.
- EA-GROWTH: High quality low dd EA using trend grids. Download EA_GROWTHJoin Our Telegram Group
")


