#EURUSD @ 1.05815 Price Analysis: Recovery targets 1.0700
…
This is a premium post.
[s2If !current_user_can(access_s2member_level4)]Please register for FREE REGISTER to read full post below containing analysis. In case of any error or you think you are not able to read the full post below, please email us at support#nehcap.com [lwa][/s2If] [s2If current_user_can(access_s2member_level1)]
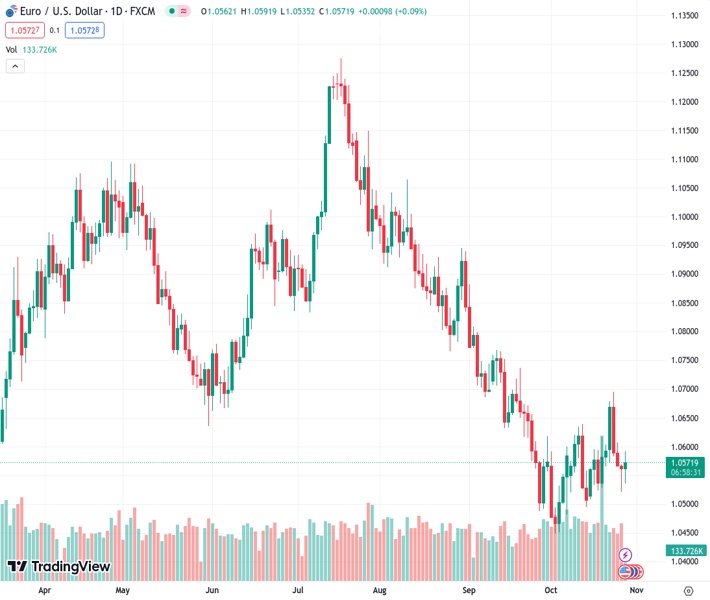
- The pair currently trades last at 1.05815.
- Pivot support is noted at 1.0532, 1.0501, 1.048
- Pivot resistance is noted at 1.0584, 1.0605, 1.0636
- EA-FIX: Check out the details here. Download EA-FIX . EA-FIX is a non-grid HFT scalper.
- EA-GROWTH: High quality low dd EA using trend grids. Download EA_GROWTHJoin Our Telegram Group
The previous day high was 1.0574 while the previous day low was 1.0522. The daily 38.2% Fib levels comes at 1.0542, expected to provide support. Similarly, the daily 61.8% fib level is at 1.0554, expected to provide support.
– EUR/USD manages to regain upside traction on Friday.
– Further gains could revisit the 1.0700 region sooner rather than later.
EUR/USD leaves behind part of the recent three-day negative streak and approaches the 1.0700 zone.
In case bulls keep pushing, the pair should meet the next hurdle at the round level of 1.0700 prior rot the weekly peaks of 1.0736 (September 20) and 1.0767 (September 12).
In the meantime, while below the 200-day SMA at 1.0812, the pair’s outlook should remain negative.
Technical Levels: Supports and Resistances
EURUSD currently trading at 1.0586 at the time of writing. Pair opened at 1.0563 and is trading with a change of 0.22 % .
| Overview | Overview.1 | |
|---|---|---|
| 0 | Today last price | 1.0586 |
| 1 | Today Daily Change | 56.0000 |
| 2 | Today Daily Change % | 0.2200 |
| 3 | Today daily open | 1.0563 |
The pair is trading above its 20 Daily moving average @ 1.0561, below its 50 Daily moving average @ 1.0666 , below its 100 Daily moving average @ 1.0821 and below its 200 Daily moving average @ 1.0815
| Trends | Trends.1 | |
|---|---|---|
| 0 | Daily SMA20 | 1.0561 |
| 1 | Daily SMA50 | 1.0666 |
| 2 | Daily SMA100 | 1.0821 |
| 3 | Daily SMA200 | 1.0815 |
The previous day high was 1.0574 while the previous day low was 1.0522. The daily 38.2% Fib levels comes at 1.0542, expected to provide support. Similarly, the daily 61.8% fib level is at 1.0554, expected to provide support.
Note the levels of interest below:
| Levels | Levels.1 |
|---|---|
| Previous Daily High | 1.0574 |
| Previous Daily Low | 1.0522 |
| Previous Weekly High | 1.0617 |
| Previous Weekly Low | 1.0511 |
| Previous Monthly High | 1.0882 |
| Previous Monthly Low | 1.0488 |
| Daily Fibonacci 38.2% | 1.0542 |
| Daily Fibonacci 61.8% | 1.0554 |
| Daily Pivot Point S1 | 1.0532 |
| Daily Pivot Point S2 | 1.0501 |
| Daily Pivot Point S3 | 1.0480 |
| Daily Pivot Point R1 | 1.0584 |
| Daily Pivot Point R2 | 1.0605 |
| Daily Pivot Point R3 | 1.0636 |
[/s2If]
Download Nehcap EAWe have two EAs that are operational on our LIVE accounts.
")


