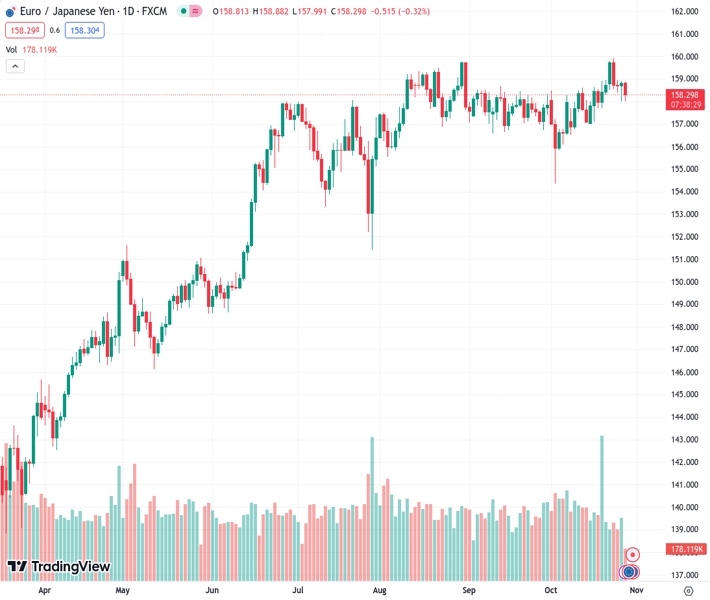
#EURJPY @ 158.309 resumes the downside and revisits the 158.00 zone.
…
This is a premium post.
[s2If !current_user_can(access_s2member_level4)]Please register for FREE REGISTER to read full post below containing analysis. In case of any error or you think you are not able to read the full post below, please email us at support#nehcap.com [lwa][/s2If] [s2If current_user_can(access_s2member_level1)]
- EUR/JPY resumes the downside and revisits the 158.00 zone.
The pair currently trades last at 158.309.
The previous day high was 158.91 while the previous day low was 157.99. The daily 38.2% Fib levels comes at 158.34, expected to provide resistance. Similarly, the daily 61.8% fib level is at 158.56, expected to provide resistance.
EUR/JPY fades Thursday’s small uptick and re-shifts its attention to the downside on Friday.
Following the ongoing price action, the cross could have now entered a consolidative phase. Against that, the breakout of this theme could encourage the index to challenge the 2023 top at 159.91 (October 24) closely followed by the round level at 160.00.
So far, the longer term positive outlook for the cross appears favoured while above the 200-day SMA, today at 151.18.
Technical Levels: Supports and Resistances
EURJPY currently trading at 158.32 at the time of writing. Pair opened at 158.6 and is trading with a change of -0.18 % .
| Overview | Overview.1 | |
|---|---|---|
| 0 | Today last price | 158.32 |
| 1 | Today Daily Change | 89.00 |
| 2 | Today Daily Change % | -0.18 |
| 3 | Today daily open | 158.60 |
The pair remains strongly bullish on the daily timeframe. It trades above its 20 SMA @ 157.88, 50 SMA 157.94, 100 SMA @ 157.0 and 200 SMA @ 151.13.
| Trends | Trends.1 | |
|---|---|---|
| 0 | Daily SMA20 | 157.88 |
| 1 | Daily SMA50 | 157.94 |
| 2 | Daily SMA100 | 157.00 |
| 3 | Daily SMA200 | 151.13 |
The previous day high was 158.91 while the previous day low was 157.99. The daily 38.2% Fib levels comes at 158.34, expected to provide resistance. Similarly, the daily 61.8% fib level is at 158.56, expected to provide resistance.
Note the levels of interest below:
- Pivot support is noted at 158.09, 157.59, 157.18
- Pivot resistance is noted at 159.0, 159.41, 159.92
| Levels | Levels.1 |
|---|---|
| Previous Daily High | 158.91 |
| Previous Daily Low | 157.99 |
| Previous Weekly High | 158.93 |
| Previous Weekly Low | 157.06 |
| Previous Monthly High | 158.66 |
| Previous Monthly Low | 156.58 |
| Daily Fibonacci 38.2% | 158.34 |
| Daily Fibonacci 61.8% | 158.56 |
| Daily Pivot Point S1 | 158.09 |
| Daily Pivot Point S2 | 157.59 |
| Daily Pivot Point S3 | 157.18 |
| Daily Pivot Point R1 | 159.00 |
| Daily Pivot Point R2 | 159.41 |
| Daily Pivot Point R3 | 159.92 |
[/s2If]
Download Nehcap EAWe have two EAs that are operational on our LIVE accounts.
- EA-FIX: Check out the details here. Download EA-FIX . EA-FIX is a non-grid HFT scalper.
- EA-GROWTH: High quality low dd EA using trend grids. Download EA_GROWTHJoin Our Telegram Group
")


