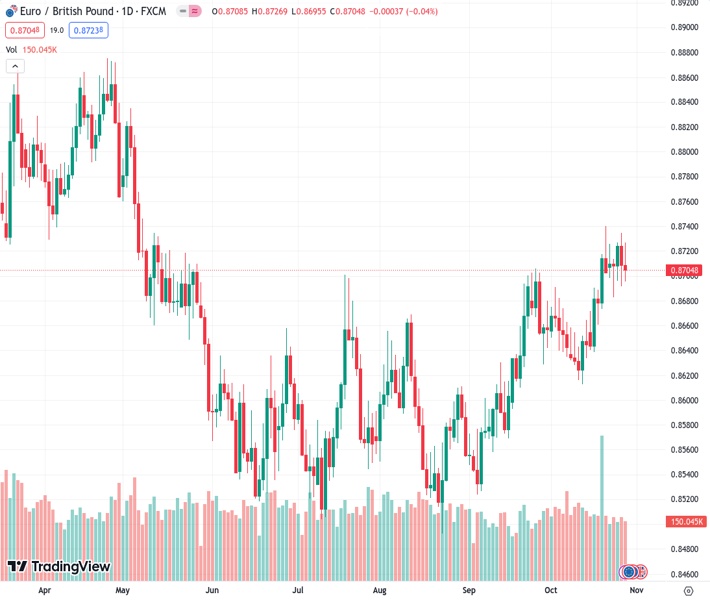
#EURGBP @ 0.87115 bottomed at a low of around 0.8695 and then recovered toward 0.8715.
…
This is a premium post.
[s2If !current_user_can(access_s2member_level4)]Please register for FREE REGISTER to read full post below containing analysis. In case of any error or you think you are not able to read the full post below, please email us at support#nehcap.com [lwa][/s2If] [s2If current_user_can(access_s2member_level1)]
- EUR/GBP bottomed at a low of around 0.8695 and then recovered toward 0.8715.
The pair currently trades last at 0.87115.
The previous day high was 0.8734 while the previous day low was 0.8692. The daily 38.2% Fib levels comes at 0.8708, expected to provide support. Similarly, the daily 61.8% fib level is at 0.8718, expected to provide resistance.
At the end of the week, the EUR/GBP bulls did their job and defended the 200-day Simple Moving Average (SMA) at 0.8695 and cleared daily losses, jumping above 0.8700. On a weekly basis, the cross will tally a third consecutive week of gains despite facing selling pressure in the last sessions.
On Thursday, the European Central Bank (ECB) decided to hold rates steady, and Christine Lagarde highlighted that the economic struggles in the Eurozone justified the decision. She then pointed out that the incoming data will be the one which ultimately decides for how long the bank will maintain its rates at a restrictive level, and as for now, markets are betting on rate cuts in April next year.
On the other hand, markets await the Bank of England’s (BoE) decision next week, expected not to deliver a hikes. However, the tone in the policy statement and Andrew Bailey’s words will likely impact the price dynamics of the GBP. In the meantime, investors are placing low odds of a hike in 2023, and rate cuts are too priced in until Q4 2024.
Based on the daily chart, the EUR/GBP exhibits a bullish outlook for the short term. Both the Relative Strength Index (RSI) and Moving Average Convergence Divergence (MACD) remain in positive territory, with the RSI above its midline and showing a northward slope. The MACD is also displaying green bars, indicating that the bulls are holding their momentum. Additionally, the pair is above the 20,100,200-day Simple Moving Average (SMA), suggesting that the bears are struggling to challenge the overall bullish trend.
That being said, on the four-hour chart, the bearish momentum is still strong, with the mentioned indicators displaying a downward trend. The RSI managed to jump to positive territory, but the MACD still shows that the sellers still have some gas left in the tank.
Support levels: 0.8695 (200-day SMA), 0.8675 (20-day SMA), 0.8650.
Resistance levels: 0.8730, 0.8750, 0.8800.
Technical Levels: Supports and Resistances
EURGBP currently trading at 0.8715 at the time of writing. Pair opened at 0.8709 and is trading with a change of 0.07 % .
| Overview | Overview.1 | |
|---|---|---|
| 0 | Today last price | 0.8715 |
| 1 | Today Daily Change | 0.0006 |
| 2 | Today Daily Change % | 0.0700 |
| 3 | Today daily open | 0.8709 |
The pair remains strongly bullish on the daily timeframe. It trades above its 20 SMA @ 0.8672, 50 SMA 0.8627, 100 SMA @ 0.8606 and 200 SMA @ 0.8695.
| Trends | Trends.1 | |
|---|---|---|
| 0 | Daily SMA20 | 0.8672 |
| 1 | Daily SMA50 | 0.8627 |
| 2 | Daily SMA100 | 0.8606 |
| 3 | Daily SMA200 | 0.8695 |
The previous day high was 0.8734 while the previous day low was 0.8692. The daily 38.2% Fib levels comes at 0.8708, expected to provide support. Similarly, the daily 61.8% fib level is at 0.8718, expected to provide resistance.
Note the levels of interest below:
- Pivot support is noted at 0.8689, 0.8669, 0.8646
- Pivot resistance is noted at 0.8732, 0.8755, 0.8775
| Levels | Levels.1 |
|---|---|
| Previous Daily High | 0.8734 |
| Previous Daily Low | 0.8692 |
| Previous Weekly High | 0.8740 |
| Previous Weekly Low | 0.8641 |
| Previous Monthly High | 0.8706 |
| Previous Monthly Low | 0.8524 |
| Daily Fibonacci 38.2% | 0.8708 |
| Daily Fibonacci 61.8% | 0.8718 |
| Daily Pivot Point S1 | 0.8689 |
| Daily Pivot Point S2 | 0.8669 |
| Daily Pivot Point S3 | 0.8646 |
| Daily Pivot Point R1 | 0.8732 |
| Daily Pivot Point R2 | 0.8755 |
| Daily Pivot Point R3 | 0.8775 |
[/s2If]
Download Nehcap EAWe have two EAs that are operational on our LIVE accounts.
- EA-FIX: Check out the details here. Download EA-FIX . EA-FIX is a non-grid HFT scalper.
- EA-GROWTH: High quality low dd EA using trend grids. Download EA_GROWTHJoin Our Telegram Group
")


