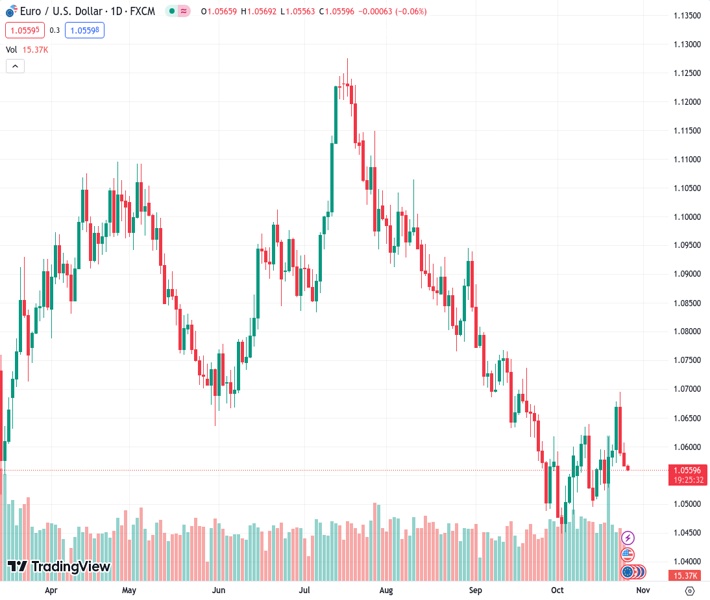
#EURUSD @ 1.05597 edges lower for the third successive day and is pressured by a combination of factors.
…
This is a premium post.
[s2If !current_user_can(access_s2member_level4)]Please register for FREE REGISTER to read full post below containing analysis. In case of any error or you think you are not able to read the full post below, please email us at support#nehcap.com [lwa][/s2If] [s2If current_user_can(access_s2member_level1)]
- EUR/USD edges lower for the third successive day and is pressured by a combination of factors.
The pair currently trades last at 1.05597.
The previous day high was 1.0607 while the previous day low was 1.0566. The daily 38.2% Fib levels comes at 1.0581, expected to provide resistance. Similarly, the daily 61.8% fib level is at 1.0591, expected to provide resistance.
The EUR/USD pair remains on the defensive during the Asian session on Thursday and currently trades around the 1.0560 area, or a one-week low as traders keenly await the European Central Bank (ECB) rate decision.
The ECB lifted rates for the 10th straight meeting in September, though signalled that a 14-month-long fight against inflation is nearing the end as price pressures are easing. Furthermore, the economy is slowing to a point that a recession may already be underway, making any further rate hikes increasingly unlikely. Nevertheless, the crucial decision is likely to infuse volatility around the shared currency and provide some meaningful impetus to the EUR/USD pair. crosses and provide
Apart from this, the focus will be on discussion about a quicker reduction of its oversized portfolio of government debt and how long rates need to stay at record highs. The markets are already betting that the next move will be a rate cut, possibly in the second quarter of next year. Hence, investors will closely scrutinize ECB President Christine Lagarde’s remarks at the post-meeting press conference for fresh cues about the central bank’s near-term monetary policy outlook.
Heading into the key event risk, a bullish US Dollar (USD), bolstered by elevated US Treasury bond yields and a generally weaker risk tone, is seen exerting some pressure on the EUR/USD pair. The yield on the benchmark 10-year US government bond remains well within the striking distance of a 16-year peak, around the 5% psychological mark briefly breached earlier this week amid growing acceptance that the Federal Reserve (Fed) will stick to its hawkish stance.
The prospects for further policy tightening by the Fed, meanwhile, continue to fuel concerns about headwinds stemming from rapidly rising borrowing costs. Adding to this, lacklustre corporate results raise worries over the economic outlook and tempers investors’ appetite for riskier assets. This, along with the risk of a further escalation of the Israel–Gaza conflict, drives some haven flows towards the Greenback and contributes to the offered tone surrounding the EUR/USD pair.
The aforementioned fundamental backdrop seems tilted in favour of bearish traders and suggests that the path of least resistance for spot prices is to the downside. Hence, any attempted recovery move might still be seen as a selling opportunity and run the risk of fizzling out rather quickly.
Technical Levels: Supports and Resistances
EURUSD currently trading at 1.0559 at the time of writing. Pair opened at 1.0567 and is trading with a change of -0.08 % .
| Overview | Overview.1 | |
|---|---|---|
| 0 | Today last price | 1.0559 |
| 1 | Today Daily Change | -0.0008 |
| 2 | Today Daily Change % | -0.0800 |
| 3 | Today daily open | 1.0567 |
The pair remains strongly bearish on the daily time frame. It trades below the 20 SMA @ 1.0561, 50 SMA 1.0672, 100 SMA @ 1.0823 and 200 SMA @ 1.0816.
| Trends | Trends.1 | |
|---|---|---|
| 0 | Daily SMA20 | 1.0561 |
| 1 | Daily SMA50 | 1.0672 |
| 2 | Daily SMA100 | 1.0823 |
| 3 | Daily SMA200 | 1.0816 |
The previous day high was 1.0607 while the previous day low was 1.0566. The daily 38.2% Fib levels comes at 1.0581, expected to provide resistance. Similarly, the daily 61.8% fib level is at 1.0591, expected to provide resistance.
Note the levels of interest below:
- Pivot support is noted at 1.0553, 1.0539, 1.0512
- Pivot resistance is noted at 1.0594, 1.0621, 1.0635
| Levels | Levels.1 |
|---|---|
| Previous Daily High | 1.0607 |
| Previous Daily Low | 1.0566 |
| Previous Weekly High | 1.0617 |
| Previous Weekly Low | 1.0511 |
| Previous Monthly High | 1.0882 |
| Previous Monthly Low | 1.0488 |
| Daily Fibonacci 38.2% | 1.0581 |
| Daily Fibonacci 61.8% | 1.0591 |
| Daily Pivot Point S1 | 1.0553 |
| Daily Pivot Point S2 | 1.0539 |
| Daily Pivot Point S3 | 1.0512 |
| Daily Pivot Point R1 | 1.0594 |
| Daily Pivot Point R2 | 1.0621 |
| Daily Pivot Point R3 | 1.0635 |
[/s2If]
Download Nehcap EAWe have two EAs that are operational on our LIVE accounts.
- EA-FIX: Check out the details here. Download EA-FIX . EA-FIX is a non-grid HFT scalper.
- EA-GROWTH: High quality low dd EA using trend grids. Download EA_GROWTHJoin Our Telegram Group
")


