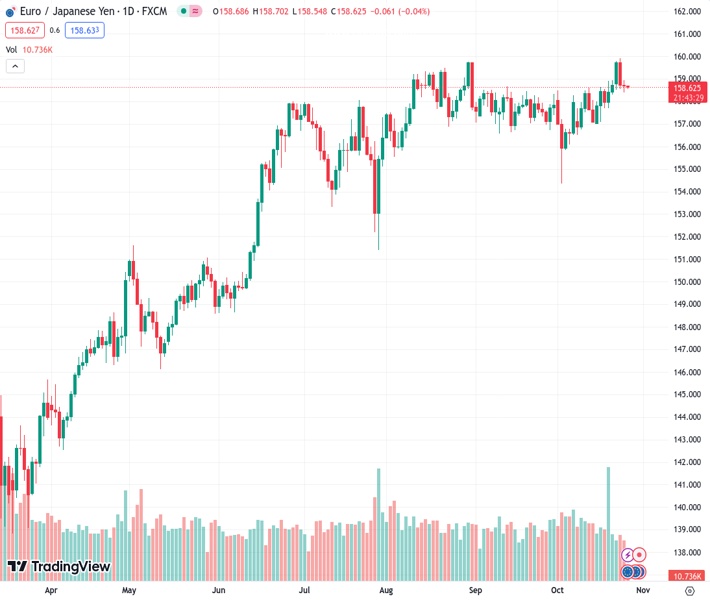
#EURJPY @ 158.628 extended its losses for two consecutive days, hitting an average daily range of 43 pips.
…
This is a premium post.
[s2If !current_user_can(access_s2member_level4)]Please register for FREE REGISTER to read full post below containing analysis. In case of any error or you think you are not able to read the full post below, please email us at support#nehcap.com [lwa][/s2If] [s2If current_user_can(access_s2member_level1)]
- EUR/JPY extended its losses for two consecutive days, hitting an average daily range of 43 pips.
The pair currently trades last at 158.628.
The previous day high was 159.92 while the previous day low was 158.54. The daily 38.2% Fib levels comes at 159.06, expected to provide resistance. Similarly, the daily 61.8% fib level is at 159.39, expected to provide resistance.
EUR/JPY extended its losses for two straight days on Wednesday, capped by the Tenkan-Sen level at 158.45, which, acting as support, halted the pair losses. Volatility in the asset was drained as the cross-pair hit an average daily range (ADR) of 43 pips. Therefore, the EUR/JPY could remain sideways, trading at 158.66 as the Asian session begins.
The lack of direction keeps the EUR/JPY pair range-bound, though slightly tilted to the upside. That is because price action is above the Ichimoku Cloud (Kumo). Hence, the first resistance would be the 159.00 mark, followed by the October 24 daily high at 159.91. A breach of the latter, and the pair might trade above 160.00.
On the other hand, the EUR/JPY first support would be the Tenkan-Sen at 158.45. If sellers manage to hurdle that level, the next floor would be the top of the Kumo at 157.90/80, followed by the Kijun-Sen at 157.13. A breakout of that price level and the bottom of the Kumo would be next at 155.60.
Technical Levels: Supports and Resistances
EURJPY currently trading at 158.68 at the time of writing. Pair opened at 158.77 and is trading with a change of -0.06 % .
| Overview | Overview.1 | |
|---|---|---|
| 0 | Today last price | 158.68 |
| 1 | Today Daily Change | -0.09 |
| 2 | Today Daily Change % | -0.06 |
| 3 | Today daily open | 158.77 |
The pair remains strongly bullish on the daily timeframe. It trades above its 20 SMA @ 157.76, 50 SMA 157.96, 100 SMA @ 156.83 and 200 SMA @ 150.94.
| Trends | Trends.1 | |
|---|---|---|
| 0 | Daily SMA20 | 157.76 |
| 1 | Daily SMA50 | 157.96 |
| 2 | Daily SMA100 | 156.83 |
| 3 | Daily SMA200 | 150.94 |
The previous day high was 159.92 while the previous day low was 158.54. The daily 38.2% Fib levels comes at 159.06, expected to provide resistance. Similarly, the daily 61.8% fib level is at 159.39, expected to provide resistance.
Note the levels of interest below:
- Pivot support is noted at 158.23, 157.69, 156.85
- Pivot resistance is noted at 159.61, 160.46, 161.0
| Levels | Levels.1 |
|---|---|
| Previous Daily High | 159.92 |
| Previous Daily Low | 158.54 |
| Previous Weekly High | 158.93 |
| Previous Weekly Low | 157.06 |
| Previous Monthly High | 158.66 |
| Previous Monthly Low | 156.58 |
| Daily Fibonacci 38.2% | 159.06 |
| Daily Fibonacci 61.8% | 159.39 |
| Daily Pivot Point S1 | 158.23 |
| Daily Pivot Point S2 | 157.69 |
| Daily Pivot Point S3 | 156.85 |
| Daily Pivot Point R1 | 159.61 |
| Daily Pivot Point R2 | 160.46 |
| Daily Pivot Point R3 | 161.00 |
[/s2If]
Download Nehcap EAWe have two EAs that are operational on our LIVE accounts.
- EA-FIX: Check out the details here. Download EA-FIX . EA-FIX is a non-grid HFT scalper.
- EA-GROWTH: High quality low dd EA using trend grids. Download EA_GROWTHJoin Our Telegram Group
")


