#USDCHF @ 0.89348 registers solid gains, bouncing from a weekly low of 0.8878 to trade at 0.8936.
…
This is a premium post.
[s2If !current_user_can(access_s2member_level4)]Please register for FREE REGISTER to read full post below containing analysis. In case of any error or you think you are not able to read the full post below, please email us at support#nehcap.com [lwa][/s2If] [s2If current_user_can(access_s2member_level1)]
- USD/CHF registers solid gains, bouncing from a weekly low of 0.8878 to trade at 0.8936.
The pair currently trades last at 0.89348.
The previous day high was 0.8957 while the previous day low was 0.8906. The daily 38.2% Fib levels comes at 0.8925, expected to provide support. Similarly, the daily 61.8% fib level is at 0.8937, expected to provide resistance.
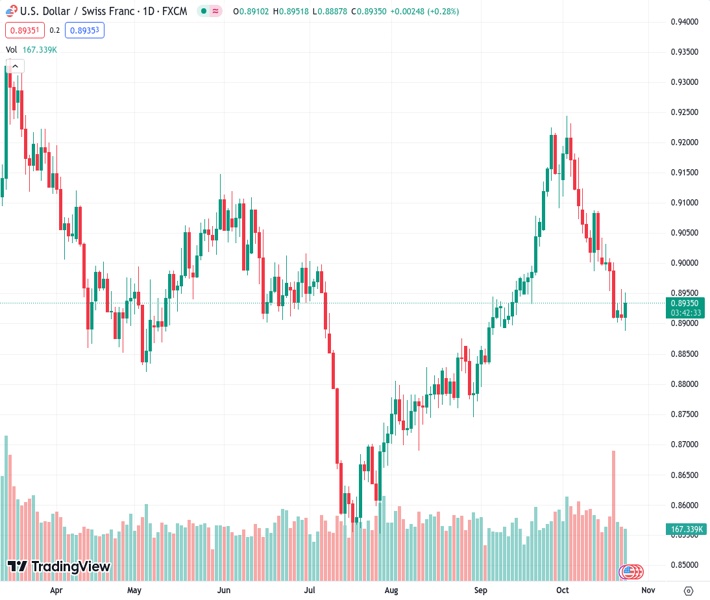
The USD/CHF advances steadily, registering solid gains of 0.33%, after bouncing from a weekly low of 0.8878. Upbeat data from the United States (US) strengthened the Greenback and lifted the major past the 0.8900 figure, currently exchanging hands at 0.8936.
From a daily chart perspective, after dropping below the 50-day moving average (DMA) at 0.5965, the downtrend remains intact unless USD/CHF breaches the latter, which could put into play a test of the 200-DMA at 0.9009. Once cleared, the USD/CHF could aim toward 0.9100.
Conversely, and the path of least resistance, the USD/CHF first support would be 0.8900, followed by the October 23 swing low of 0.8878. IF sellers reclaim those levels, the next stop would be the August 30 swing low of 0.8819, ahead of the 0.8800 mark.
Technical Levels: Supports and Resistances
USDCHF currently trading at 0.8937 at the time of writing. Pair opened at 0.8912 and is trading with a change of 0.28 % .
| Overview | Overview.1 | |
|---|---|---|
| 0 | Today last price | 0.8937 |
| 1 | Today Daily Change | 0.0025 |
| 2 | Today Daily Change % | 0.2800 |
| 3 | Today daily open | 0.8912 |
The pair is trading below its 20 Daily moving average @ 0.9072, below its 50 Daily moving average @ 0.8963 , above its 100 Daily moving average @ 0.89 and below its 200 Daily moving average @ 0.9012
| Trends | Trends.1 | |
|---|---|---|
| 0 | Daily SMA20 | 0.9072 |
| 1 | Daily SMA50 | 0.8963 |
| 2 | Daily SMA100 | 0.8900 |
| 3 | Daily SMA200 | 0.9012 |
The previous day high was 0.8957 while the previous day low was 0.8906. The daily 38.2% Fib levels comes at 0.8925, expected to provide support. Similarly, the daily 61.8% fib level is at 0.8937, expected to provide resistance.
Note the levels of interest below:
- Pivot support is noted at 0.8893, 0.8873, 0.8841
- Pivot resistance is noted at 0.8944, 0.8976, 0.8995
| Levels | Levels.1 |
|---|---|
| Previous Daily High | 0.8957 |
| Previous Daily Low | 0.8906 |
| Previous Weekly High | 0.9042 |
| Previous Weekly Low | 0.8902 |
| Previous Monthly High | 0.9225 |
| Previous Monthly Low | 0.8795 |
| Daily Fibonacci 38.2% | 0.8925 |
| Daily Fibonacci 61.8% | 0.8937 |
| Daily Pivot Point S1 | 0.8893 |
| Daily Pivot Point S2 | 0.8873 |
| Daily Pivot Point S3 | 0.8841 |
| Daily Pivot Point R1 | 0.8944 |
| Daily Pivot Point R2 | 0.8976 |
| Daily Pivot Point R3 | 0.8995 |
[/s2If]
Download Nehcap EAWe have two EAs that are operational on our LIVE accounts.
- EA-FIX: Check out the details here. Download EA-FIX . EA-FIX is a non-grid HFT scalper.
- EA-GROWTH: High quality low dd EA using trend grids. Download EA_GROWTHJoin Our Telegram Group
")


