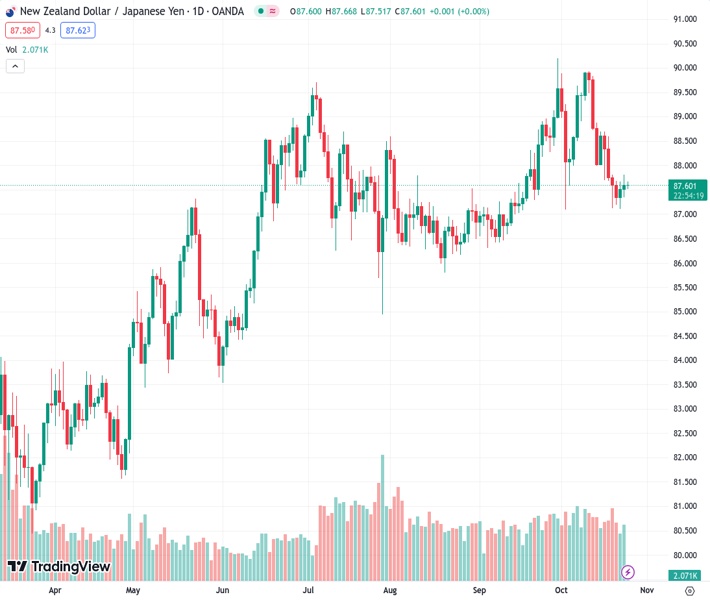
#NZDJPY @ 87.5770 The advanced above the 100-day SMA, closing at 87.60.
…
This is a premium post.
[s2If !current_user_can(access_s2member_level4)]Please register for FREE REGISTER to read full post below containing analysis. In case of any error or you think you are not able to read the full post below, please email us at support#nehcap.com [lwa][/s2If] [s2If current_user_can(access_s2member_level1)]
- The NZD/JPY advanced above the 100-day SMA, closing at 87.60.
The pair currently trades last at 87.5770.
The previous day high was 87.67 while the previous day low was 87.1. The daily 38.2% Fib levels comes at 87.45, expected to provide support. Similarly, the daily 61.8% fib level is at 87.32, expected to provide support.
In Tuesday’s session, the NZD/JPY gained some reactions and closed just above the 100-day Simple Moving Average (SMA) at 87.60.
Observing the daily chart, the pair displays a bearish technical outlook for the short term as the bears gained significant momentum and asserted their presence in the latest session. However, the cross lost more than 1% last week, and the pair may consolidate those losses in the next sessions. In the meantime, the Relative Strength Index (RSI) shows a flat slope in the negative territory, while the Moving Average Convergence (MACD) histogram lays out lower red bars.
If the bears push the cross back below the 100-day Simple Moving Average (SMA), they may target multi-month lows around 85.80. On the other hand, the pair may trade sideways to consolidate the recent downward movements.
Support levels: 87.58 (100-day SMA), 87.13, 86.50.
Resistance levels: 87.80, 88.30, 88.50.
Technical Levels: Supports and Resistances
NZDJPY currently trading at 87.6 at the time of writing. Pair opened at 87.51 and is trading with a change of 0.1 % .
| Overview | Overview.1 | |
|---|---|---|
| 0 | Today last price | 87.60 |
| 1 | Today Daily Change | 0.09 |
| 2 | Today Daily Change % | 0.10 |
| 3 | Today daily open | 87.51 |
The pair is trading below its 20 Daily moving average @ 88.61, below its 50 Daily moving average @ 87.65 , above its 100 Daily moving average @ 87.52 and above its 200 Daily moving average @ 85.63
| Trends | Trends.1 | |
|---|---|---|
| 0 | Daily SMA20 | 88.61 |
| 1 | Daily SMA50 | 87.65 |
| 2 | Daily SMA100 | 87.52 |
| 3 | Daily SMA200 | 85.63 |
The previous day high was 87.67 while the previous day low was 87.1. The daily 38.2% Fib levels comes at 87.45, expected to provide support. Similarly, the daily 61.8% fib level is at 87.32, expected to provide support.
Note the levels of interest below:
- Pivot support is noted at 87.18, 86.85, 86.6
- Pivot resistance is noted at 87.76, 88.0, 88.33
| Levels | Levels.1 |
|---|---|
| Previous Daily High | 87.67 |
| Previous Daily Low | 87.10 |
| Previous Weekly High | 88.70 |
| Previous Weekly Low | 87.12 |
| Previous Monthly High | 90.21 |
| Previous Monthly Low | 86.30 |
| Daily Fibonacci 38.2% | 87.45 |
| Daily Fibonacci 61.8% | 87.32 |
| Daily Pivot Point S1 | 87.18 |
| Daily Pivot Point S2 | 86.85 |
| Daily Pivot Point S3 | 86.60 |
| Daily Pivot Point R1 | 87.76 |
| Daily Pivot Point R2 | 88.00 |
| Daily Pivot Point R3 | 88.33 |
[/s2If]
Download Nehcap EAWe have two EAs that are operational on our LIVE accounts.
- EA-FIX: Check out the details here. Download EA-FIX . EA-FIX is a non-grid HFT scalper.
- EA-GROWTH: High quality low dd EA using trend grids. Download EA_GROWTHJoin Our Telegram Group
")


