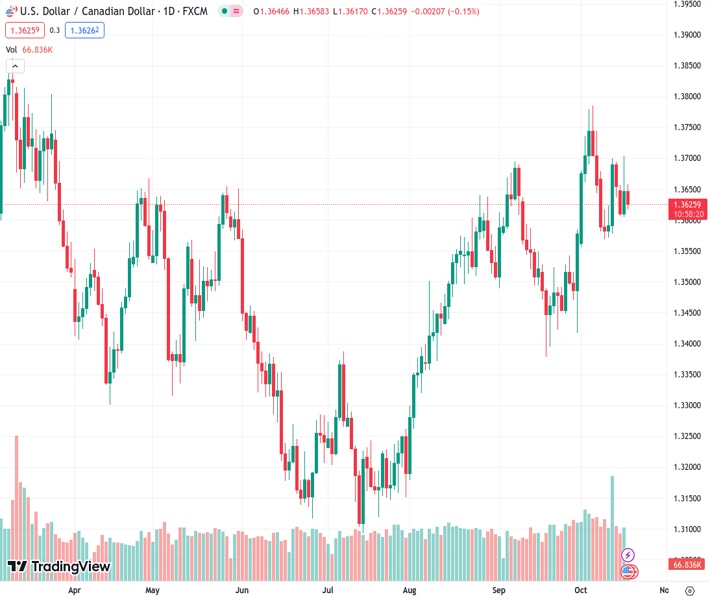
#USDCAD @ 1.36245 retreats from 1.3650 but stays inside Tuesday’s range.
…
This is a premium post.
[s2If !current_user_can(access_s2member_level4)]Please register for FREE REGISTER to read full post below containing analysis. In case of any error or you think you are not able to read the full post below, please email us at support#nehcap.com [lwa][/s2If] [s2If current_user_can(access_s2member_level1)]
- USD/CAD retreats from 1.3650 but stays inside Tuesday’s range.
The pair currently trades last at 1.36245.
The previous day high was 1.3703 while the previous day low was 1.3607. The daily 38.2% Fib levels comes at 1.3666, expected to provide resistance. Similarly, the daily 61.8% fib level is at 1.3643, expected to provide resistance.
The USD/CAD pair demonstrates a compression in volatility, trading inside Tuesday’s range of 1.3600-1.3700 ahead of the speech from Federal Reserve (Fed) Chair Jerome Powell, scheduled for Wednesday.
The Loonie asset delivered volatile spikes on Tuesday after Statistics Canada reported soft inflation data and the United States Census Bureau reported strong Retail Sales for September. Consumer spending rose by 0.7% due to robust demand for automobiles and higher gasoline prices.
Canada’s monthly headline and core Consumer Price Index (CPI) contracted by 0.1% while investors forecasted a growth by 0.1%. The annual headline and core CPI softened to 3.8% and 2.8% respectively. A soft Canada inflation report has dented hopes of one more interest rate increase from the Bank of Canada (BoC).
USD/CAD trades directionless in a Symmetrical Triangle chart pattern formed on a two-hour scale, which indicates a squeeze in volatility. The upward-sloping trendline of the aforementioned chart pattern is plotted from October 10 low around 1.3570 while the downward-sloping trendline is placed from October 5 high at 1.3786.
The Loonie asset has dropped to near 100-period Exponential Moving Average (EMA) at 1.3610. A further breakdown could strengthen the Canadian Dollar.
The Relative Strength Index (RSI) (14) oscillates in the 40.00-60.00 range, portraying a consolidation ahead.
A decisive break above March 24 high around 1.3800 would expose the asset to March 10 high at 1.3860, followed by the round-level resistance at 1.3900.
In an alternate scenario, a breakdown below September 25 low around 1.3450 would drag the asset toward September 20 low near 1.3400. A further breakdown could expose the asset to a six-week low near 1.3356.
Technical Levels: Supports and Resistances
USDCAD currently trading at 1.3624 at the time of writing. Pair opened at 1.365 and is trading with a change of -0.19 % .
| Overview | Overview.1 | |
|---|---|---|
| 0 | Today last price | 1.3624 |
| 1 | Today Daily Change | -0.0026 |
| 2 | Today Daily Change % | -0.1900 |
| 3 | Today daily open | 1.3650 |
The pair remains strongly bullish on the daily timeframe. It trades above its 20 SMA @ 1.3592, 50 SMA 1.3563, 100 SMA @ 1.3417 and 200 SMA @ 1.3466.
| Trends | Trends.1 | |
|---|---|---|
| 0 | Daily SMA20 | 1.3592 |
| 1 | Daily SMA50 | 1.3563 |
| 2 | Daily SMA100 | 1.3417 |
| 3 | Daily SMA200 | 1.3466 |
The previous day high was 1.3703 while the previous day low was 1.3607. The daily 38.2% Fib levels comes at 1.3666, expected to provide resistance. Similarly, the daily 61.8% fib level is at 1.3643, expected to provide resistance.
Note the levels of interest below:
- Pivot support is noted at 1.3603, 1.3557, 1.3507
- Pivot resistance is noted at 1.3699, 1.3749, 1.3796
| Levels | Levels.1 |
|---|---|
| Previous Daily High | 1.3703 |
| Previous Daily Low | 1.3607 |
| Previous Weekly High | 1.3701 |
| Previous Weekly Low | 1.3569 |
| Previous Monthly High | 1.3694 |
| Previous Monthly Low | 1.3379 |
| Daily Fibonacci 38.2% | 1.3666 |
| Daily Fibonacci 61.8% | 1.3643 |
| Daily Pivot Point S1 | 1.3603 |
| Daily Pivot Point S2 | 1.3557 |
| Daily Pivot Point S3 | 1.3507 |
| Daily Pivot Point R1 | 1.3699 |
| Daily Pivot Point R2 | 1.3749 |
| Daily Pivot Point R3 | 1.3796 |
[/s2If]
Download Nehcap EAWe have two EAs that are operational on our LIVE accounts.
- EA-FIX: Check out the details here. Download EA-FIX . EA-FIX is a non-grid HFT scalper.
- EA-GROWTH: High quality low dd EA using trend grids. Download EA_GROWTHJoin Our Telegram Group
")


