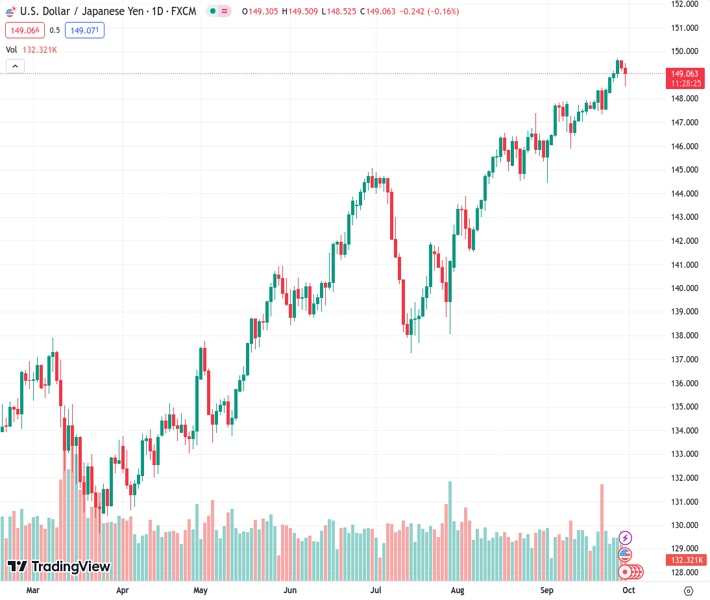
The USDJPY pair remains close to the significant psychological level of 149.00 in anticipation of the release of the US Core Personal Consumption Expenditures (PCE) data.
…
This is a premium post.
[s2If !current_user_can(access_s2member_level4)]Please register for FREE REGISTER to read full post below containing analysis. In case of any error or you think you are not able to read the full post below, please email us at support#nehcap.com [lwa][/s2If] [s2If current_user_can(access_s2member_level1)]
- USD/JPY hovers around 149.00 psychological level ahead of US Core PCE.
The pair currently trades last at 149.035.
The previous day high was 149.64 while the previous day low was 149.15. The daily 38.2% Fib levels comes at 149.33, expected to provide resistance. Similarly, the daily 61.8% fib level is at 149.45, expected to provide resistance.
USD/JPY extends its losses on the second successive day, trading lower around 149.00 psychological level during the European trading session on Friday.
The pair faces a challenge due to the correction in the US Dollar (USD), which could be attributed to the pullback in the US Treasury yields.
The 14-day Exponential Moving Average (EMA) at 148.36 could act as key support, following the 21-day EMA at 147.87.
A firm break could influence the USD/JPY bears to navigate the area around the 23.6% Fibonacci retracement at 146.76, followed by the 146.00 psychological level.
The current upward momentum in USD/JPY appears to have a bullish bias, given that the 14-day Relative Strength Index (RSI) remains above the 50 level.
However, there is a resistance region around the monthly high at 149.70, followed by the 150.00 psychological level that may pose a challenge for further gains.
The Moving Average Convergence Divergence (MACD) indicator is providing a strong signal for the USD’s buyers. The MACD line lies above the centerline and the signal line. This configuration suggests that there is potentially strong momentum in the USD/JPY’s price movement.
Technical Levels: Supports and Resistances
USDJPY currently trading at 149.07 at the time of writing. Pair opened at 149.31 and is trading with a change of -0.16 % .
| Overview | Overview.1 | |
|---|---|---|
| 0 | Today last price | 149.07 |
| 1 | Today Daily Change | -0.24 |
| 2 | Today Daily Change % | -0.16 |
| 3 | Today daily open | 149.31 |
The pair remains strongly bullish on the daily timeframe. It trades above its 20 SMA @ 147.82, 50 SMA 145.52, 100 SMA @ 143.02 and 200 SMA @ 137.95.
| Trends | Trends.1 | |
|---|---|---|
| 0 | Daily SMA20 | 147.82 |
| 1 | Daily SMA50 | 145.52 |
| 2 | Daily SMA100 | 143.02 |
| 3 | Daily SMA200 | 137.95 |
The previous day high was 149.64 while the previous day low was 149.15. The daily 38.2% Fib levels comes at 149.33, expected to provide resistance. Similarly, the daily 61.8% fib level is at 149.45, expected to provide resistance.
Note the levels of interest below:
- Pivot support is noted at 149.09, 148.87, 148.59
- Pivot resistance is noted at 149.59, 149.86, 150.08
| Levels | Levels.1 |
|---|---|
| Previous Daily High | 149.64 |
| Previous Daily Low | 149.15 |
| Previous Weekly High | 148.46 |
| Previous Weekly Low | 147.32 |
| Previous Monthly High | 147.38 |
| Previous Monthly Low | 141.51 |
| Daily Fibonacci 38.2% | 149.33 |
| Daily Fibonacci 61.8% | 149.45 |
| Daily Pivot Point S1 | 149.09 |
| Daily Pivot Point S2 | 148.87 |
| Daily Pivot Point S3 | 148.59 |
| Daily Pivot Point R1 | 149.59 |
| Daily Pivot Point R2 | 149.86 |
| Daily Pivot Point R3 | 150.08 |
[/s2If]
Download Nehcap EAWe have two EAs that are operational on our LIVE accounts.
- EA-FIX: Check out the details here. Download EA-FIX . EA-FIX is a non-grid HFT scalper.
- EA-GROWTH: High quality low dd EA using trend grids. Download EA_GROWTHJoin Our Telegram Group
")


