Thursday saw an increase in the exchange rate between the Euro and the US Dollar as the US Dollar Index (DXY) decreased.
…
This is a premium post.
[s2If !current_user_can(access_s2member_level4)]Please register for FREE REGISTER to read full post below containing analysis. In case of any error or you think you are not able to read the full post below, please email us at support#nehcap.com [lwa][/s2If] [s2If current_user_can(access_s2member_level1)]
- The EUR/USD saw gains for Thursday as the DXY recedes.
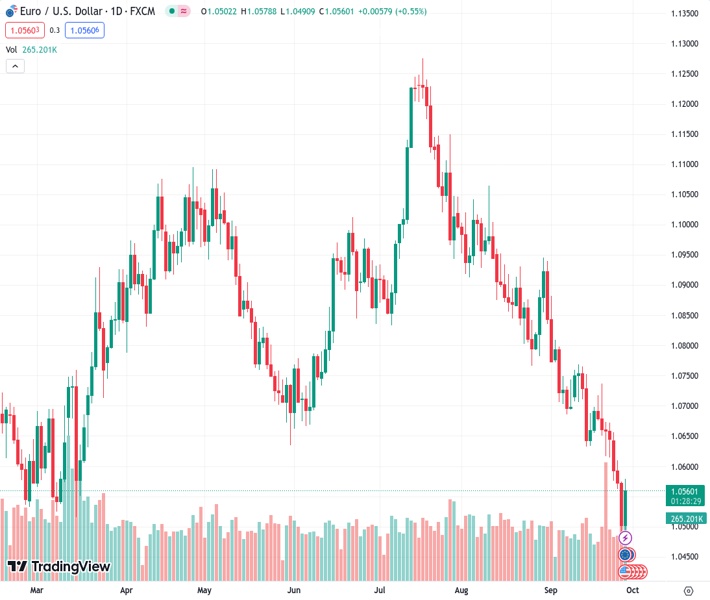
The pair currently trades last at 1.05604.
The previous day high was 1.0575 while the previous day low was 1.0488. The daily 38.2% Fib levels comes at 1.0521, expected to provide support. Similarly, the daily 61.8% fib level is at 1.0542, expected to provide support.
The EUR/USD tapped into an intraday high of 1.0580 on Thursday before settling to close out the US trading session down near 0.10550. The US Dollar (USD) has gained across the board with the US Dollar Index (DXY) catching a broad-market lift as risk appetite sours on weakening economic data, spiking Treasury yields, and recession concerns.
Investors are gearing up for a full data docket on Friday, with European Consumer Price Index (CPI) figures kicking things off.
European inflation is expected to decline moderately. with the annualized CPI reading for September forecast to tick down from 5.3% to 4.8%.
Market forecasters are expecting a half-percent cut in the rate of price growth for Europe as the continental economy wobbles, with a dovish European Central Bank (ECB) looking entirely set to start looking for rate cuts if the economy continues to sour.
Friday will also see US Personal Consumption Expenditure (PCE) Price Index numbers. US PCE inflation is forecast to hold steady for the month of August at 0.2%, while the annualized figure for the same period is seen ticking lower from 4.2% to 3.9%.
Analysts broadly expect both EU and US inflation readings to step lower, but the weak-side bet goes to Europe as price growth is expected to slump noticeably in the coming months.
Read More:
The Pound and Euro should weaken substantially through early 2024 – Wells Fargo
EUR/USD Price Analysis: A drop to the YTD low appears on the table
Eurozone HICP Preview: Forecasts from five major banks, overall inflation-slowing trend
The EUR/USD is testing around 1.0555 after taking a downside rebound from the 100-hour Simple Moving Average (SMA) near 1.0580 in mid-Thursday trading. Hourly candles have broken to the upside of a descending intraday trendline from last week’s swing high near 1.0730.
Technical resistance comes from the 200-hour SMA near 1.0620, while near-term price action will see support from the 34-hour Exponential Moving Average (EMA) near 1.0540.
On the daily candlesticks, the EUR/USD is desperate for a green day after closing flat or in the red for the past seven straight trading sessions, and price action still remains firmly bearish with upside momentum capped by a descending trendline from July’s peak near 1.1275.
The EUR/USD daily candles have accelerated away from the 200-day SMA, which is turning bearish from just north of the 1.0800 handle.
Technical Levels: Supports and Resistances
EURUSD currently trading at 1.0556 at the time of writing. Pair opened at 1.0503 and is trading with a change of 0.5 % .
| Overview | Overview.1 | |
|---|---|---|
| 0 | Today last price | 1.0556 |
| 1 | Today Daily Change | 0.0053 |
| 2 | Today Daily Change % | 0.5000 |
| 3 | Today daily open | 1.0503 |
The pair remains strongly bearish on the daily time frame. It trades below the 20 SMA @ 1.069, 50 SMA 1.0845, 100 SMA @ 1.0865 and 200 SMA @ 1.0829.
| Trends | Trends.1 | |
|---|---|---|
| 0 | Daily SMA20 | 1.0690 |
| 1 | Daily SMA50 | 1.0845 |
| 2 | Daily SMA100 | 1.0865 |
| 3 | Daily SMA200 | 1.0829 |
The previous day high was 1.0575 while the previous day low was 1.0488. The daily 38.2% Fib levels comes at 1.0521, expected to provide support. Similarly, the daily 61.8% fib level is at 1.0542, expected to provide support.
Note the levels of interest below:
- Pivot support is noted at 1.0469, 1.0435, 1.0383
- Pivot resistance is noted at 1.0556, 1.0608, 1.0642
| Levels | Levels.1 |
|---|---|
| Previous Daily High | 1.0575 |
| Previous Daily Low | 1.0488 |
| Previous Weekly High | 1.0737 |
| Previous Weekly Low | 1.0615 |
| Previous Monthly High | 1.1065 |
| Previous Monthly Low | 1.0766 |
| Daily Fibonacci 38.2% | 1.0521 |
| Daily Fibonacci 61.8% | 1.0542 |
| Daily Pivot Point S1 | 1.0469 |
| Daily Pivot Point S2 | 1.0435 |
| Daily Pivot Point S3 | 1.0383 |
| Daily Pivot Point R1 | 1.0556 |
| Daily Pivot Point R2 | 1.0608 |
| Daily Pivot Point R3 | 1.0642 |
[/s2If]
Download Nehcap EAWe have two EAs that are operational on our LIVE accounts.
- EA-FIX: Check out the details here. Download EA-FIX . EA-FIX is a non-grid HFT scalper.
- EA-GROWTH: High quality low dd EA using trend grids. Download EA_GROWTHJoin Our Telegram Group
")


