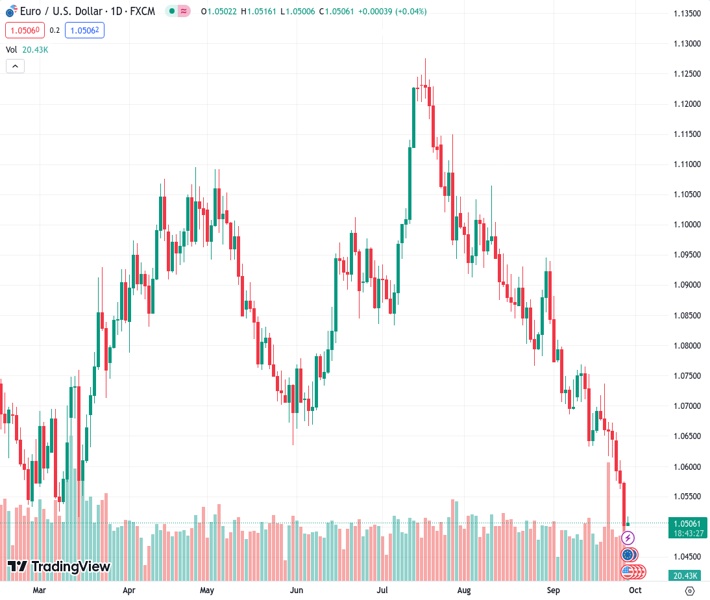
The EURUSD currency pair, currently valued at 1.05071, is experiencing a decline due to the stronger US dollar and positive data coming out of the US.
…
This is a premium post.
[s2If !current_user_can(access_s2member_level4)]Please register for FREE REGISTER to read full post below containing analysis. In case of any error or you think you are not able to read the full post below, please email us at support#nehcap.com [lwa][/s2If] [s2If current_user_can(access_s2member_level1)]
- EUR/USD loses traction amid the firmer US dollar and upbeat US data.
The pair currently trades last at 1.05071.
The previous day high was 1.0575 while the previous day low was 1.0488. The daily 38.2% Fib levels comes at 1.0521, expected to provide resistance. Similarly, the daily 61.8% fib level is at 1.0542, expected to provide resistance.
The EUR/USD pair loses momentum around 1.0500 during the early Asian session on Thursday. The selling pressure of the major pair is supported by the firmer US Dollar (USD), higher US economic data, and higher Treasury yield. EUR/USD currently trades near 1.0512, gaining 0.09% for the day.
Meanwhile, the US Dollar Index (DXY), a measure of the value of the USD relative to a basket of foreign currencies, climbs to 106.60, the highest since November whereas US Treasury yields edge higher with the 10-year Treasury yield settled at 4.618%, its highest level since 2007.
The downbeat Eurozone economic data exert some selling pressure on the Euro and acts as a headwind for the EUR/USD pair. German Consumer Sentiment revealed by GfK fell to -26.5 in October from -25.6 in September. Furthermore, Spain and Germany will publish preliminary September Consumer Price Index (CPI) numbers. Spanish annual inflation is expected to rise, while German inflation will likely decline. These initial inflation figures are crucial for shaping monetary policy expectations and can impact the markets.
Across the pond, the US Census Bureau revealed on Wednesday that US Durable Goods Orders improved in August, climbing 0.2% m/m from the previous reading’s 5.6% fall, compared to estimates for a 0.5% m/m drop. Furthermore, Durable Goods Orders Excluding Transportation rose by 0.4% m/m, above the 0.1% gain anticipated. Core capital goods orders grew 0.9% from the previous month’s figure of 0.4%, above the market estimate of 0%. Following the better-than-expected US data, the Greenback gains traction across the board, acting as a headwind for the EUR/USD pair.
Markets were driven by risk-aversion as investors weighed higher for longer rates narrative against growth risks from the possibility of an imminent government shutdown in the US. Traders will monitor Federal Reserve (Fed) Chair Jerome Powell’s address this week for fresh catalysts. The less hawkish tone of officials may limit the USD’s upside and lift the Euro.
Looking ahead, market players await the preliminary Spanish and German inflation data for September. Also, the Eurozone’s Consumer and Business Confidence data will be released on Thursday. On the US docket, the US weekly Jobless Claims report, the third revision of Gross Domestic Product (GDP) for the second quarter and Pending Home Sales data will be released on Thursday. The attention will shift to the US Core Personal Consumption Expenditure (PCE) Price Index on Friday. The annual figure is expected to ease from 4.2% to 3.9%. Traders will take cues from the data and find a clear direction of the EUR/USD pair.
Technical Levels: Supports and Resistances
EURUSD currently trading at 1.0511 at the time of writing. Pair opened at 1.0503 and is trading with a change of 0.08 % .
| Overview | Overview.1 | |
|---|---|---|
| 0 | Today last price | 1.0511 |
| 1 | Today Daily Change | 0.0008 |
| 2 | Today Daily Change % | 0.0800 |
| 3 | Today daily open | 1.0503 |
The pair remains strongly bearish on the daily time frame. It trades below the 20 SMA @ 1.069, 50 SMA 1.0845, 100 SMA @ 1.0865 and 200 SMA @ 1.0829.
| Trends | Trends.1 | |
|---|---|---|
| 0 | Daily SMA20 | 1.0690 |
| 1 | Daily SMA50 | 1.0845 |
| 2 | Daily SMA100 | 1.0865 |
| 3 | Daily SMA200 | 1.0829 |
The previous day high was 1.0575 while the previous day low was 1.0488. The daily 38.2% Fib levels comes at 1.0521, expected to provide resistance. Similarly, the daily 61.8% fib level is at 1.0542, expected to provide resistance.
Note the levels of interest below:
- Pivot support is noted at 1.0469, 1.0435, 1.0383
- Pivot resistance is noted at 1.0556, 1.0608, 1.0642
| Levels | Levels.1 |
|---|---|
| Previous Daily High | 1.0575 |
| Previous Daily Low | 1.0488 |
| Previous Weekly High | 1.0737 |
| Previous Weekly Low | 1.0615 |
| Previous Monthly High | 1.1065 |
| Previous Monthly Low | 1.0766 |
| Daily Fibonacci 38.2% | 1.0521 |
| Daily Fibonacci 61.8% | 1.0542 |
| Daily Pivot Point S1 | 1.0469 |
| Daily Pivot Point S2 | 1.0435 |
| Daily Pivot Point S3 | 1.0383 |
| Daily Pivot Point R1 | 1.0556 |
| Daily Pivot Point R2 | 1.0608 |
| Daily Pivot Point R3 | 1.0642 |
[/s2If]
Download Nehcap EAWe have two EAs that are operational on our LIVE accounts.
- EA-FIX: Check out the details here. Download EA-FIX . EA-FIX is a non-grid HFT scalper.
- EA-GROWTH: High quality low dd EA using trend grids. Download EA_GROWTHJoin Our Telegram Group
")


