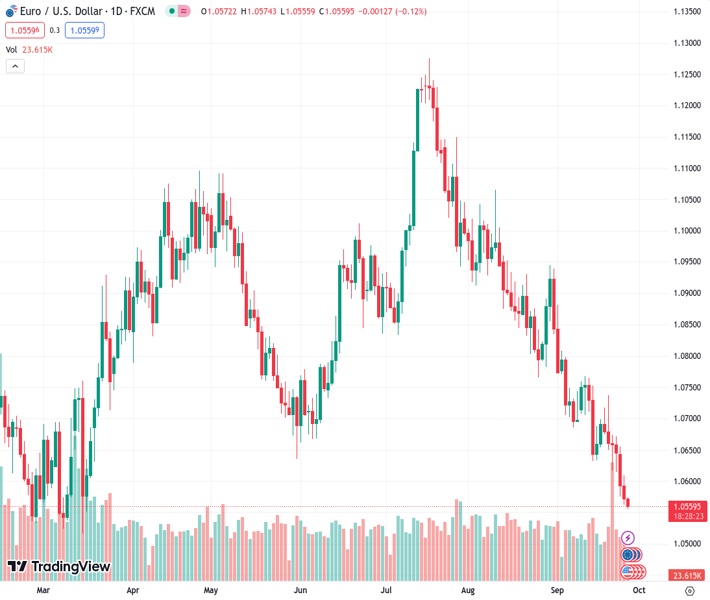
The EURUSD pair at a rate of 1.05603 is facing difficulty in making any significant progress and continues to stay at a low level seen over several months.
…
This is a premium post.
[s2If !current_user_can(access_s2member_level4)]Please register for FREE REGISTER to read full post below containing analysis. In case of any error or you think you are not able to read the full post below, please email us at support#nehcap.com [lwa][/s2If] [s2If current_user_can(access_s2member_level1)]
- EUR/USD struggles to gain any meaningful traction and remains depressed near a multi-month low.
The pair currently trades last at 1.05603.
The previous day high was 1.0609 while the previous day low was 1.0562. The daily 38.2% Fib levels comes at 1.058, expected to provide resistance. Similarly, the daily 61.8% fib level is at 1.0591, expected to provide resistance.
The EUR/USD pair enters a bearish consolidation phase and oscillates in a narrow range near its lowest level since March 16, around the 1.0555 area touched during the Asian session on Wednesday.
The US Dollar (USD) remains well supported near a 10-month high in the wake of growing acceptance that the Federal Reserve (Fed) will keep interest rates higher for longer and continues to act as a headwind for the EUR/USD pair. In fact, the Fed stuck a more hawkish tone last week and warned that still-sticky inflation was likely to attract at least one more interest rate hike by the end of this year.
Moreover, the recent comments by several Fed officials, along with the US economic resilience, reaffirm expectations for further policy tightening by the US central bank. The outlook remains supportive of elevated US Treasury bond yields and continues to underpin the USD. Apart from this, a generally weaker risk tone benefits the safe-haven buck and contributes to capping the EUR/USD pair.
Against the backdrop of persistent worries about a real estate crisis in China, concerns about economic headwinds stemming from rapidly rising borrowing costs temper investors’ appetite for riskier assets. This, along with the European Central Bank’s (ECB) dovish rate decision earlier this month, suggests that the path of least resistance for the EUR/USD pair remains to the downside.
The ECB downgraded its CPI and GDP growth forecasts for 2024 and 2025, suggesting that additional rate hikes may be off the table for now. Furthermore, speculations about a possible contraction in GDP during the second half of the year reaffirm bets that the ECB’s 14-month-long policy tightening cycle could have reached its peak already and favours the EUR/USD bears.
Traders now look to the release of the German GfK Consumer Climate Index for some impetus ahead of the US Durable Goods Orders data, due later during the early North American session. The focus will then shift to the flash German CPI report, the final US GDP print and Fed Chair Jerome Powell’s speech on Thursday. This will be followed by the US Core PCE Price Index on Friday.
Technical Levels: Supports and Resistances
EURUSD currently trading at 1.0564 at the time of writing. Pair opened at 1.0573 and is trading with a change of -0.09 % .
| Overview | Overview.1 | |
|---|---|---|
| 0 | Today last price | 1.0564 |
| 1 | Today Daily Change | -0.0009 |
| 2 | Today Daily Change % | -0.0900 |
| 3 | Today daily open | 1.0573 |
The pair remains strongly bearish on the daily time frame. It trades below the 20 SMA @ 1.0711, 50 SMA 1.0859, 100 SMA @ 1.0869 and 200 SMA @ 1.083.
| Trends | Trends.1 | |
|---|---|---|
| 0 | Daily SMA20 | 1.0711 |
| 1 | Daily SMA50 | 1.0859 |
| 2 | Daily SMA100 | 1.0869 |
| 3 | Daily SMA200 | 1.0830 |
The previous day high was 1.0609 while the previous day low was 1.0562. The daily 38.2% Fib levels comes at 1.058, expected to provide resistance. Similarly, the daily 61.8% fib level is at 1.0591, expected to provide resistance.
Note the levels of interest below:
- Pivot support is noted at 1.0554, 1.0534, 1.0507
- Pivot resistance is noted at 1.0601, 1.0628, 1.0648
| Levels | Levels.1 |
|---|---|
| Previous Daily High | 1.0609 |
| Previous Daily Low | 1.0562 |
| Previous Weekly High | 1.0737 |
| Previous Weekly Low | 1.0615 |
| Previous Monthly High | 1.1065 |
| Previous Monthly Low | 1.0766 |
| Daily Fibonacci 38.2% | 1.0580 |
| Daily Fibonacci 61.8% | 1.0591 |
| Daily Pivot Point S1 | 1.0554 |
| Daily Pivot Point S2 | 1.0534 |
| Daily Pivot Point S3 | 1.0507 |
| Daily Pivot Point R1 | 1.0601 |
| Daily Pivot Point R2 | 1.0628 |
| Daily Pivot Point R3 | 1.0648 |
[/s2If]
Download Nehcap EAWe have two EAs that are operational on our LIVE accounts.
- EA-FIX: Check out the details here. Download EA-FIX . EA-FIX is a non-grid HFT scalper.
- EA-GROWTH: High quality low dd EA using trend grids. Download EA_GROWTHJoin Our Telegram Group
")


