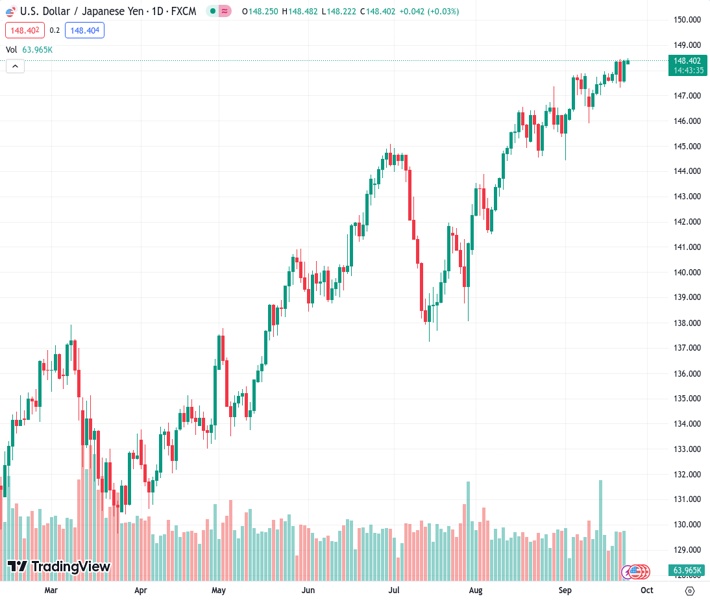
On Monday, the USDJPY pair hovers consistently near the 148.35 level, with minimal fluctuations, staying within a tight range.
…
This is a premium post.
[s2If !current_user_can(access_s2member_level4)]Please register for FREE REGISTER to read full post below containing analysis. In case of any error or you think you are not able to read the full post below, please email us at support#nehcap.com [lwa][/s2If] [s2If current_user_can(access_s2member_level1)]
- USD/JPY oscillates in a narrow range around 148.35 on Monday.
The pair currently trades last at 148.389.
The previous day high was 148.42 while the previous day low was 147.51. The daily 38.2% Fib levels comes at 148.07, expected to provide support. Similarly, the daily 61.8% fib level is at 147.85, expected to provide support.
The USD/JPY pair remains flat below the mid-148.00s during the early European session on Monday. Markets turn cautious amid the fear of FX intervention by the Japanese authorities. The pair currently trades around 148.35, losing 0.01% on the day.
The Bank of Japan (BOJ) Governor Kazuo Ueda stated on Monday that Japan’s economy recovering moderately and the central bank’s basic stance is that they must patiently maintain monetary easing. Additionally, Japan’s Finance Minister Shunichi Suzuki was out with some usual verbal intervention last week. He said that authorities will closely watch FX moves with a high sense of urgency and won’t rule out any options for response to excessive FX volatility. Similarly, the Bank of Japan (BoJ) Governor Ueda emphasized the need to spend more time assessing data before raising interest rates. This, in turn, might cap the upside of the US Dollar (USD) and act as a headwind for the USD/JPY pair.
Apart from this, economic data released on Friday revealed that Japan’s National Consumer Price Index (CPI) for August came in at 3.2% YoY from 3.3% in July. Additionally, the National CPI ex Fresh Food improved from 3.0% in July to 3.1% in August, whereas the National CPI ex Food, Energy came in at 4.3% compared to 4.3% in previous readings.
On the USD’s front, Friday’s Purchasing Managers Index data prompted concerns about the trajectory of demand conditions in the US economy in the wake of interest rate hikes cycle and elevated inflation. The US S&P Global Manufacturing PMI grew to 48.9 in September from 47.9 in August, indicating that manufacturing sector business activity continues to contract. The Services PMI fell to 50.2 from 50.5 the previous month, while the Composite PMI dropped to 50.1 from 50.2.
Most Fed officials still expect the additional rate to rise later this year. Susan Collins and Mary Daly, presidents of the Federal Reserve Banks of Boston and San Francisco, emphasized that although inflation is cooling down, additional rate hikes would be necessary. Furthermore, Minneapolis Federal Reserve President Neel Kashkari said he would have thought with 500 basis points (bps) or 525 bps of interest rate increases as they would have slammed the brakes on consumer spending and it has not slammed the brakes on consumer spending.
Market participants will monitor Japan’s Tokyo Consumer Price Index (CPI) for September, Industrial Production, and Retail Sales due on Friday. The key event this week will be the US Core Personal Consumption Expenditure (PCE) Price Index, the Fed’s preferred measure of consumer inflation. The annual figure is expected to drop from 4.2% to 3.9%. Traders will take cues from these figures and find trading opportunities around the USD/JPY pair.
Technical Levels: Supports and Resistances
USDJPY currently trading at 148.37 at the time of writing. Pair opened at 148.37 and is trading with a change of 0.0 % .
| Overview | Overview.1 | |
|---|---|---|
| 0 | Today last price | 148.37 |
| 1 | Today Daily Change | 0.00 |
| 2 | Today Daily Change % | 0.00 |
| 3 | Today daily open | 148.37 |
The pair remains strongly bullish on the daily timeframe. It trades above its 20 SMA @ 147.18, 50 SMA 144.73, 100 SMA @ 142.44 and 200 SMA @ 137.64.
| Trends | Trends.1 | |
|---|---|---|
| 0 | Daily SMA20 | 147.18 |
| 1 | Daily SMA50 | 144.73 |
| 2 | Daily SMA100 | 142.44 |
| 3 | Daily SMA200 | 137.64 |
The previous day high was 148.42 while the previous day low was 147.51. The daily 38.2% Fib levels comes at 148.07, expected to provide support. Similarly, the daily 61.8% fib level is at 147.85, expected to provide support.
Note the levels of interest below:
- Pivot support is noted at 147.78, 147.19, 146.87
- Pivot resistance is noted at 148.69, 149.01, 149.6
| Levels | Levels.1 |
|---|---|
| Previous Daily High | 148.42 |
| Previous Daily Low | 147.51 |
| Previous Weekly High | 148.46 |
| Previous Weekly Low | 147.32 |
| Previous Monthly High | 147.38 |
| Previous Monthly Low | 141.51 |
| Daily Fibonacci 38.2% | 148.07 |
| Daily Fibonacci 61.8% | 147.85 |
| Daily Pivot Point S1 | 147.78 |
| Daily Pivot Point S2 | 147.19 |
| Daily Pivot Point S3 | 146.87 |
| Daily Pivot Point R1 | 148.69 |
| Daily Pivot Point R2 | 149.01 |
| Daily Pivot Point R3 | 149.60 |
[/s2If]
Download Nehcap EAWe have two EAs that are operational on our LIVE accounts.
- EA-FIX: Check out the details here. Download EA-FIX . EA-FIX is a non-grid HFT scalper.
- EA-GROWTH: High quality low dd EA using trend grids. Download EA_GROWTHJoin Our Telegram Group
")


