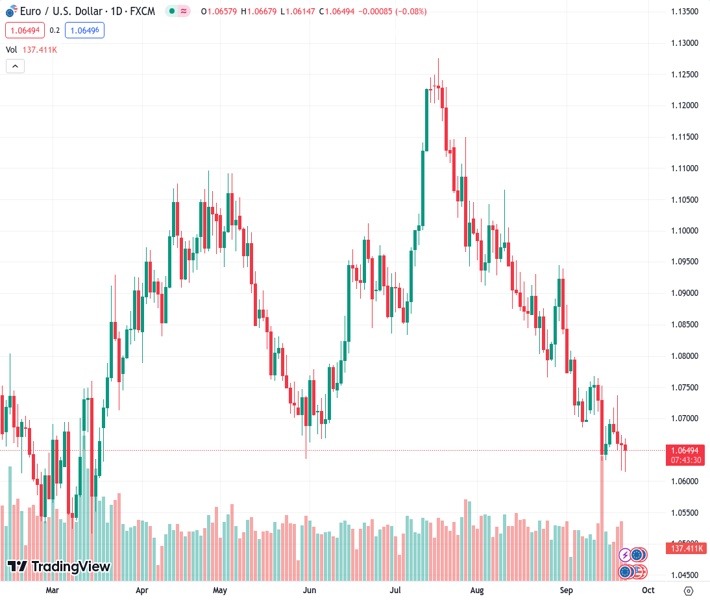
The EURUSD currency pair has dropped to a new low for the past six months, reaching a level close to 1.0610.
…
This is a premium post.
[s2If !current_user_can(access_s2member_level4)]Please register for FREE REGISTER to read full post below containing analysis. In case of any error or you think you are not able to read the full post below, please email us at support#nehcap.com [lwa][/s2If] [s2If current_user_can(access_s2member_level1)]
- EUR/USD clinches new six-month lows near 1.0610.
The pair currently trades last at 1.06521.
The previous day high was 1.0674 while the previous day low was 1.0617. The daily 38.2% Fib levels comes at 1.0639, expected to provide support. Similarly, the daily 61.8% fib level is at 1.0652, expected to provide support.
EUR/USD keeps the negative price action well in place and retreats to fresh multi-month lows around 1.0615 on Friday.
If the pair breaches this level in the short-term horizon, it could then open the door to a potential retracement to the March low of 1.0516 (Mar 8), which is the last defence ahead of an assault on the 2023 low at 1.0481 (January 6).
While below the key 200-day SMA at 1.0828, the pair is likely to face extra weakness.
Technical Levels: Supports and Resistances
EURUSD currently trading at 1.0656 at the time of writing. Pair opened at 1.066 and is trading with a change of -0.04 % .
| Overview | Overview.1 | |
|---|---|---|
| 0 | Today last price | 1.0656 |
| 1 | Today Daily Change | 57.0000 |
| 2 | Today Daily Change % | -0.0400 |
| 3 | Today daily open | 1.0660 |
The pair remains strongly bearish on the daily time frame. It trades below the 20 SMA @ 1.0745, 50 SMA 1.0897, 100 SMA @ 1.0881 and 200 SMA @ 1.083.
| Trends | Trends.1 | |
|---|---|---|
| 0 | Daily SMA20 | 1.0745 |
| 1 | Daily SMA50 | 1.0897 |
| 2 | Daily SMA100 | 1.0881 |
| 3 | Daily SMA200 | 1.0830 |
The previous day high was 1.0674 while the previous day low was 1.0617. The daily 38.2% Fib levels comes at 1.0639, expected to provide support. Similarly, the daily 61.8% fib level is at 1.0652, expected to provide support.
Note the levels of interest below:
- Pivot support is noted at 1.0627, 1.0594, 1.057
- Pivot resistance is noted at 1.0683, 1.0707, 1.074
| Levels | Levels.1 |
|---|---|
| Previous Daily High | 1.0674 |
| Previous Daily Low | 1.0617 |
| Previous Weekly High | 1.0769 |
| Previous Weekly Low | 1.0632 |
| Previous Monthly High | 1.1065 |
| Previous Monthly Low | 1.0766 |
| Daily Fibonacci 38.2% | 1.0639 |
| Daily Fibonacci 61.8% | 1.0652 |
| Daily Pivot Point S1 | 1.0627 |
| Daily Pivot Point S2 | 1.0594 |
| Daily Pivot Point S3 | 1.0570 |
| Daily Pivot Point R1 | 1.0683 |
| Daily Pivot Point R2 | 1.0707 |
| Daily Pivot Point R3 | 1.0740 |
[/s2If]
Download Nehcap EAWe have two EAs that are operational on our LIVE accounts.
- EA-FIX: Check out the details here. Download EA-FIX . EA-FIX is a non-grid HFT scalper.
- EA-GROWTH: High quality low dd EA using trend grids. Download EA_GROWTHJoin Our Telegram Group
")


