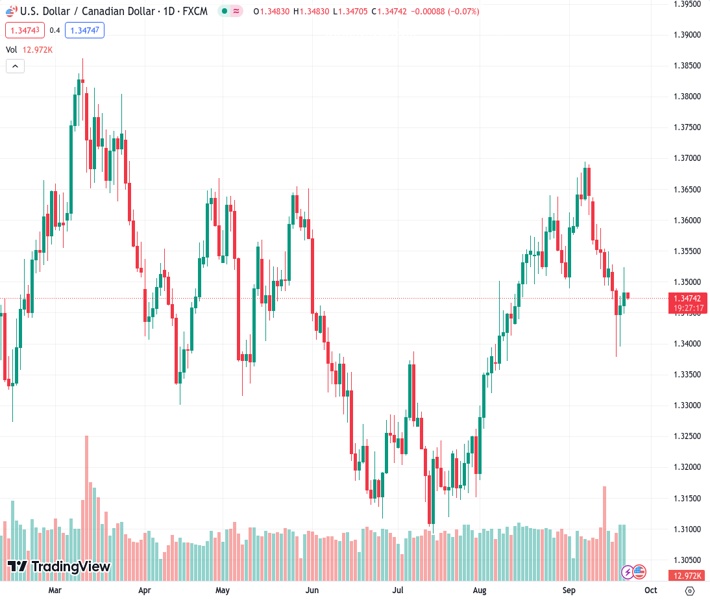
The currency pair USDCAD, currently at 1.34728, is fluctuating around the level of 1.3480 in anticipation of upcoming economic information from both countries.
…
This is a premium post.
[s2If !current_user_can(access_s2member_level4)]Please register for FREE REGISTER to read full post below containing analysis. In case of any error or you think you are not able to read the full post below, please email us at support#nehcap.com [lwa][/s2If] [s2If current_user_can(access_s2member_level1)]
- USD/CAD hovers around 1.3480 ahead of economic data from both nations.
The pair currently trades last at 1.34728.
The previous day high was 1.3524 while the previous day low was 1.3453. The daily 38.2% Fib levels comes at 1.3497, expected to provide resistance. Similarly, the daily 61.8% fib level is at 1.348, expected to provide resistance.
USD/CAD attempts to snap a two-day winning streak, hovering around 1.3480 during the early trading hours of the Asian session on Friday. The Canadian Dollar (CAD) experienced support as the US Dollar (USD) witnessed correction, coupled with the gains in Crude prices.
West Texas Intermediate (WTI) crude oil is trading around $89.50 per barrel by the press time, as it seeks to build on its recent gains. This uptrend is being driven by the intentional production cutbacks by OPEC+ producers, who are working to reduce the supply of crude oil in the market.
US Dollar Index (DXY) trades higher around 105.40 at the time of writing, which could be partly attributed to the upbeat US Treasury yields. The yield on a 10-year US bond improved to 4.50% by the press time.
Market participants will likely pay close attention to economic data releases, including the preliminary US S&P Global PMIs for September and Canada’s Retail Sales for July. These figures can provide valuable insights into the economic conditions of both countries, which could be helpful in finding trading opportunities around the USD/CAD pair.
Economic data from the United States (US) released on Thursday exhibited a mixed performance. Initially, it bolstered the US Dollar and indicated the presence of a resilient labor market. However, it subsequently began to undergo a correction.
US Initial Jobless Claims on the week ending on September 15, reported 201,000 figures, swinging from the previous reading of 221,000, the lowest level since January. The data was expected to release a higher figure of 225,000.
The Philadelphia Fed Manufacturing Survey declined to 13.5 in September against the expected reduction of 0.7 from the positive reading of 12 previously. While Existing Home Sales (MoM) declined in August to a monthly figure of 4.04 million from the 4.07 million priors, which was expected to grow at 4.10 million.
As widely anticipated in the market, the Federal Reserve (Fed) decided to maintain interest rates within the 5.25-5.50% range during its Wednesday meeting.
Fed Chairman Jerome Powell, during a press conference, reiterated the Fed’s dedication to achieving a 2% inflation target while also stating that the Fed is prepared to increase rates if deemed necessary. These hawkish comments have bolstered the US Dollar and are acting as a tailwind for the USD/CAD pair.
Technical Levels: Supports and Resistances
USDCAD currently trading at 1.348 at the time of writing. Pair opened at 1.3484 and is trading with a change of -0.03 % .
| Overview | Overview.1 | |
|---|---|---|
| 0 | Today last price | 1.3480 |
| 1 | Today Daily Change | -0.0004 |
| 2 | Today Daily Change % | -0.0300 |
| 3 | Today daily open | 1.3484 |
The pair is trading below its 20 Daily moving average @ 1.3558, above its 50 Daily moving average @ 1.3436 , above its 100 Daily moving average @ 1.3398 and above its 200 Daily moving average @ 1.3463
| Trends | Trends.1 | |
|---|---|---|
| 0 | Daily SMA20 | 1.3558 |
| 1 | Daily SMA50 | 1.3436 |
| 2 | Daily SMA100 | 1.3398 |
| 3 | Daily SMA200 | 1.3463 |
The previous day high was 1.3524 while the previous day low was 1.3453. The daily 38.2% Fib levels comes at 1.3497, expected to provide resistance. Similarly, the daily 61.8% fib level is at 1.348, expected to provide resistance.
Note the levels of interest below:
- Pivot support is noted at 1.345, 1.3416, 1.3379
- Pivot resistance is noted at 1.352, 1.3558, 1.3591
| Levels | Levels.1 |
|---|---|
| Previous Daily High | 1.3524 |
| Previous Daily Low | 1.3453 |
| Previous Weekly High | 1.3639 |
| Previous Weekly Low | 1.3493 |
| Previous Monthly High | 1.3640 |
| Previous Monthly Low | 1.3184 |
| Daily Fibonacci 38.2% | 1.3497 |
| Daily Fibonacci 61.8% | 1.3480 |
| Daily Pivot Point S1 | 1.3450 |
| Daily Pivot Point S2 | 1.3416 |
| Daily Pivot Point S3 | 1.3379 |
| Daily Pivot Point R1 | 1.3520 |
| Daily Pivot Point R2 | 1.3558 |
| Daily Pivot Point R3 | 1.3591 |
[/s2If]
Download Nehcap EAWe have two EAs that are operational on our LIVE accounts.
- EA-FIX: Check out the details here. Download EA-FIX . EA-FIX is a non-grid HFT scalper.
- EA-GROWTH: High quality low dd EA using trend grids. Download EA_GROWTHJoin Our Telegram Group
")


