The British pound against the US dollar declined significantly due to a cautious stance taken by the Bank of England on Thursday.
…
This is a premium post.
[s2If !current_user_can(access_s2member_level4)]Please register for FREE REGISTER to read full post below containing analysis. In case of any error or you think you are not able to read the full post below, please email us at support#nehcap.com [lwa][/s2If] [s2If current_user_can(access_s2member_level1)]
- The GBP/USD tumbled on a dovish BoE on Thursday.
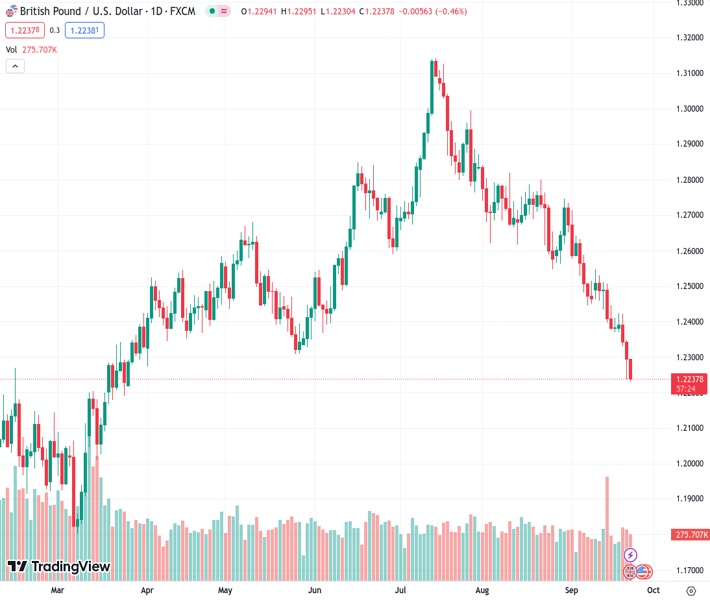
The pair currently trades last at 1.22388.
The previous day high was 1.2352 while the previous day low was 1.2235. The daily 38.2% Fib levels comes at 1.228, expected to provide resistance. Similarly, the daily 61.8% fib level is at 1.2307, expected to provide resistance.
The GBP/USD is looking for further downside to end the trading week, probing chart space below 1.2250 heading into the final hours of Friday’s trading session.
The UK’s Bank of England (BoE) came in dovish this week after British inflation came in much lower than previously anticipated. The BoE held its benchmark rate at 5.25%, waffling on a market-expected 25-basis-point increase to 5.5%.
UK Retail Sales on Friday missed expectations, printing at 0.4%. The figure rebounded from the previous reading of -1.1%, but failed to capture the market forecast of 0.5%.
UK Purchasing Manager Index (PMI) figures mixed towards the downside, capping any upside potential for the Pound Sterling (GBP).
The preliminary UK S&P Global/CIPS Composite PMI for September declined to 46.8, missing the expected increase to 48.7. The previous month’s PMI came in at 48.6.
The manufacturing component of the UK PMI came in better than expected at 48.9 versus the forecast 48.0, but the services sector PMI declined to 47.2 compared to the forecast 49.2.
On the US side, PMIs also came in mixed. The composite ticked lower to 50.1 from 50.2. The manufacturing PMI jumped to 48.9 from the previous 47.9, while the services component slipped to 50.2 from 50.5 and walking back the expected uptick to 50.6.
Read more:
BoE holds interest rate steady at 5.25% in split vote
UK Preliminary Services PMI declines to 47.2 in September vs. 49.5 expected
US S&P Global Manufacturing PMI improves to 48.9, Services PMI declines to 50.2 in September
The Pound Sterling continues to struggle against the US Dollar, with the GBP/USD down almost 1.5% from the week’s high near 1.2425.
The pair briefly pierced the 100-hour Simple Moving Average (SMA) on Wednesday but has fallen to the downside, now trading beneath the 34-hour Exponential Moving Average (EMA) currently drifting to the low side of 1.2280.
Daily candlesticks have the GBP/USD piercing the 200-day SMA just above 1.2400, and continued downside will see the pair set to challenge six-month lows, with little technical support between current prices and 2023’s lows near 1.1825.
Technical Levels: Supports and Resistances
GBPUSD currently trading at 1.2246 at the time of writing. Pair opened at 1.2298 and is trading with a change of -0.42 % .
| Overview | Overview.1 | |
|---|---|---|
| 0 | Today last price | 1.2246 |
| 1 | Today Daily Change | -0.0052 |
| 2 | Today Daily Change % | -0.4200 |
| 3 | Today daily open | 1.2298 |
The pair remains strongly bearish on the daily time frame. It trades below the 20 SMA @ 1.2507, 50 SMA 1.2683, 100 SMA @ 1.2647 and 200 SMA @ 1.2434.
| Trends | Trends.1 | |
|---|---|---|
| 0 | Daily SMA20 | 1.2507 |
| 1 | Daily SMA50 | 1.2683 |
| 2 | Daily SMA100 | 1.2647 |
| 3 | Daily SMA200 | 1.2434 |
The previous day high was 1.2352 while the previous day low was 1.2235. The daily 38.2% Fib levels comes at 1.228, expected to provide resistance. Similarly, the daily 61.8% fib level is at 1.2307, expected to provide resistance.
Note the levels of interest below:
- Pivot support is noted at 1.2238, 1.2179, 1.2122
- Pivot resistance is noted at 1.2355, 1.2411, 1.2471
| Levels | Levels.1 |
|---|---|
| Previous Daily High | 1.2352 |
| Previous Daily Low | 1.2235 |
| Previous Weekly High | 1.2548 |
| Previous Weekly Low | 1.2379 |
| Previous Monthly High | 1.2841 |
| Previous Monthly Low | 1.2548 |
| Daily Fibonacci 38.2% | 1.2280 |
| Daily Fibonacci 61.8% | 1.2307 |
| Daily Pivot Point S1 | 1.2238 |
| Daily Pivot Point S2 | 1.2179 |
| Daily Pivot Point S3 | 1.2122 |
| Daily Pivot Point R1 | 1.2355 |
| Daily Pivot Point R2 | 1.2411 |
| Daily Pivot Point R3 | 1.2471 |
[/s2If]
Download Nehcap EAWe have two EAs that are operational on our LIVE accounts.
- EA-FIX: Check out the details here. Download EA-FIX . EA-FIX is a non-grid HFT scalper.
- EA-GROWTH: High quality low dd EA using trend grids. Download EA_GROWTHJoin Our Telegram Group
")


