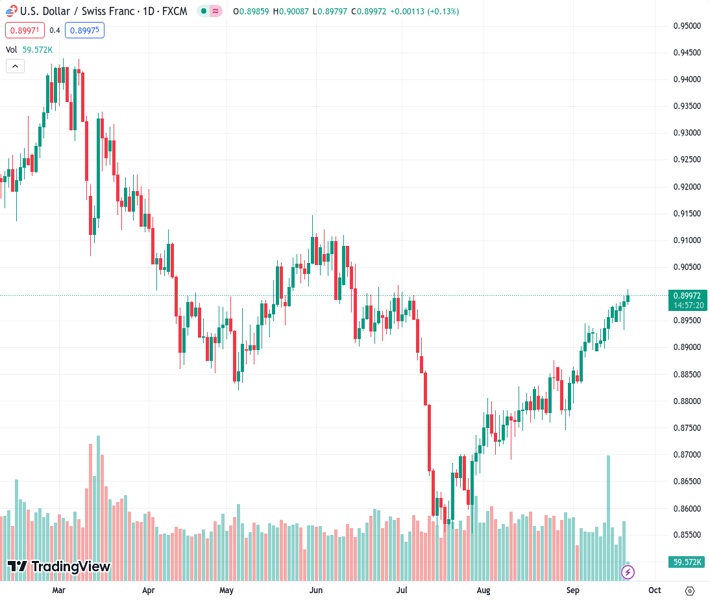
The USDCHF pair, currently trading at 0.89975, is continuing to rise for the third consecutive day, remaining near the 0.9000 range.
…
This is a premium post.
[s2If !current_user_can(access_s2member_level4)]Please register for FREE REGISTER to read full post below containing analysis. In case of any error or you think you are not able to read the full post below, please email us at support#nehcap.com [lwa][/s2If] [s2If current_user_can(access_s2member_level1)]
- USD/CHF extends its upside for the third straight day, hovering around the 0.9000 area.
The pair currently trades last at 0.89975.
The previous day high was 0.8996 while the previous day low was 0.8932. The daily 38.2% Fib levels comes at 0.8971, expected to provide support. Similarly, the daily 61.8% fib level is at 0.8956, expected to provide support.
The USD/CHF pair gains momentum near the 0.9000 psychological mark during the early European session on Thursday. Market players await the Swiss National Bank (SNB) interest rate decision later in the day.
SNB is expected to raise additional interest rates by 25 basis points (bps) from 1.75% to 2% on Thursday. However, if SNB offers hints about its last hike, the monetary policy divergences between the US and Switzerland might continue to drive the pair higher.
On the US Dollar front, the Federal Reserve (Fed) held interest rates unchanged at the 5.25-5.50% range on Wednesday, as widely predicted in the market. Fed Chairman Jerome Powell reaffirmed the Fed’s commitment to achieving 2% inflation in a press conference while mentioning that the Fed is ready to raise rates if necessary. These hawkish remarks boost the Greenback against the Swiss Franc and act as a tailwind for the USD/CHF pair.
According to the four-hour chart, USD/CHF holds above the 50- and 100-hour Exponential Moving Averages (EMAs), which means the path of least resistance for the pair is to the upside. The Relative Strength Index (RSI) holds in bullish territory above 50. However, the overbought condition indicates that further consolidation cannot be ruled out before positioning for any near-term USD/CHF appreciation.
That said, the immediate resistance level for USD/CHF will emerge near the upper boundary of the Bollinger Band at 0.9032. The additional upside filter is located at 0.9060 (a high of May 19) en route to 0.9073 (a high of May 25) and finally at 0.9105 (a high of June 8).
On the downside, the 100-hour EMA at 0.8906 acts as a critical support level for the pair. Further south, the next stop of the USD/CHF pair is located at 0.8870 (the 50-hour EMA), followed by a psychological round figure at 0.8800. Any intraday pullback below the latter would expose the next downside stop at 0.8775, portraying the confluence of the lower limit of the Bollinger Band and a low of August 23.
Technical Levels: Supports and Resistances
USDCHF currently trading at 0.8996 at the time of writing. Pair opened at 0.8986 and is trading with a change of 0.11 % .
| Overview | Overview.1 | |
|---|---|---|
| 0 | Today last price | 0.8996 |
| 1 | Today Daily Change | 0.0010 |
| 2 | Today Daily Change % | 0.1100 |
| 3 | Today daily open | 0.8986 |
The pair is trading above its 20 Daily moving average @ 0.8896, above its 50 Daily moving average @ 0.8788 , above its 100 Daily moving average @ 0.8882 and below its 200 Daily moving average @ 0.9037
| Trends | Trends.1 | |
|---|---|---|
| 0 | Daily SMA20 | 0.8896 |
| 1 | Daily SMA50 | 0.8788 |
| 2 | Daily SMA100 | 0.8882 |
| 3 | Daily SMA200 | 0.9037 |
The previous day high was 0.8996 while the previous day low was 0.8932. The daily 38.2% Fib levels comes at 0.8971, expected to provide support. Similarly, the daily 61.8% fib level is at 0.8956, expected to provide support.
Note the levels of interest below:
- Pivot support is noted at 0.8947, 0.8908, 0.8884
- Pivot resistance is noted at 0.9011, 0.9035, 0.9074
| Levels | Levels.1 |
|---|---|
| Previous Daily High | 0.8996 |
| Previous Daily Low | 0.8932 |
| Previous Weekly High | 0.8978 |
| Previous Weekly Low | 0.8897 |
| Previous Monthly High | 0.8876 |
| Previous Monthly Low | 0.8690 |
| Daily Fibonacci 38.2% | 0.8971 |
| Daily Fibonacci 61.8% | 0.8956 |
| Daily Pivot Point S1 | 0.8947 |
| Daily Pivot Point S2 | 0.8908 |
| Daily Pivot Point S3 | 0.8884 |
| Daily Pivot Point R1 | 0.9011 |
| Daily Pivot Point R2 | 0.9035 |
| Daily Pivot Point R3 | 0.9074 |
[/s2If]
Download Nehcap EAWe have two EAs that are operational on our LIVE accounts.
- EA-FIX: Check out the details here. Download EA-FIX . EA-FIX is a non-grid HFT scalper.
- EA-GROWTH: High quality low dd EA using trend grids. Download EA_GROWTHJoin Our Telegram Group
")


