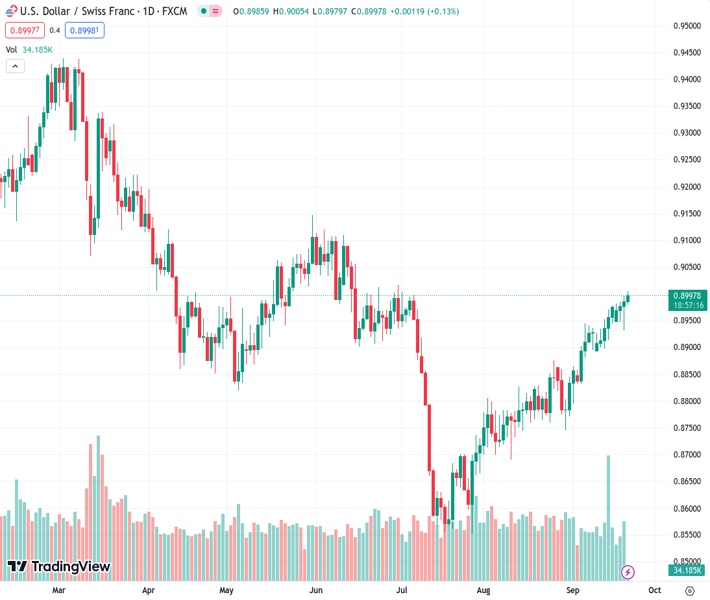
The USDCHF pair, currently trading at 0.89966, continues its upward trend that has been ongoing for two months and reaches its highest level since the end of June.
…
This is a premium post.
[s2If !current_user_can(access_s2member_level4)]Please register for FREE REGISTER to read full post below containing analysis. In case of any error or you think you are not able to read the full post below, please email us at support#nehcap.com [lwa][/s2If] [s2If current_user_can(access_s2member_level1)]
- USD/CHF prolongs its two-month-old uptrend and climbs to its highest level since late June.
The pair currently trades last at 0.89966.
The previous day high was 0.8996 while the previous day low was 0.8932. The daily 38.2% Fib levels comes at 0.8971, expected to provide support. Similarly, the daily 61.8% fib level is at 0.8956, expected to provide support.
The USD/CHF pair touches its highest level since late June during the Asian session on Thursday, with bulls now looking to build on the momentum further beyond the 0.9000 psychological mark.
The US Dollar (USD) builds on the previous day’s hawkish Federal Reserve (Fed)-inspired recovery from over a one-week low and has now moved well within the striking distance of a six-month high, which, in turn, acts as a tailwind for the USD/CHF pair. The US central bank, as was anticipated, decided to leave the benchmark federal funds rate unchanged on Wednesday, though signalled one more rate hike by the end of this year. In fact, the so-called ‘dot-plot’ forecasted rates to peak at 5.5% to 5.75% in 2023. Adding to this, policymakers now see the benchmark rate at 5.1% next year, suggesting just two rate cuts in 2024 as compared to four rate cuts projected previously.
This reaffirms a higher-for-longer narrative and pushes the yield on the rate-sensitive two-year US government bond to a 17-year high. Furthermore, the benchmark 10-year yield has climbed to its highest since late 2007, which continues to boost the Greenback and assists the USD/CHF pair to prolong its strong upward trajectory witnessed over the past two months or so. With the latest leg up, spot prices have now rallied around 450 pips from the July swing low, though some follow-through buying and acceptance above the 0.9000 mark is needed to support prospects for additional gains. The market focus now shifts to the Swiss National Bank (SNB) policy meeting, due this Thursday.
The current market pricing indicates a greater possibility that the SNB will hike interest rates for the sixth successive time in SSeptember That said, the recent slew of weak real economy data, sub-2% readings on the headline and core inflation, and the strengthening of the Swiss Franc (CHF) against its European counterpart might force the central bank to limit any further tightening. Hence, the accompanying monetary policy statement will be scrutinized for cues about the future rate-hike path and provide some impetus to the USD/CHF pair.
Later during the early North American session, the US economic docket – featuring the usual Initial Weekly Jobless Claims, Philly Fed Manufacturing Index and Existing Home Sales data – will also be looked upon for short-term opportunities. Nevertheless, the aforementioned fundamental backdrop seems tilted in favour of the USD bulls and suggests that the path of least resistance for the USD/CHF pair is to the upside. Hence, any immediate market reaction to a more hawkish SNB is more likely to be seen as an opportunity for bullish traders and remain limited.
Technical Levels: Supports and Resistances
USDCHF currently trading at 0.9004 at the time of writing. Pair opened at 0.8986 and is trading with a change of 0.2 % .
| Overview | Overview.1 | |
|---|---|---|
| 0 | Today last price | 0.9004 |
| 1 | Today Daily Change | 0.0018 |
| 2 | Today Daily Change % | 0.2000 |
| 3 | Today daily open | 0.8986 |
The pair is trading above its 20 Daily moving average @ 0.8896, above its 50 Daily moving average @ 0.8788 , above its 100 Daily moving average @ 0.8882 and below its 200 Daily moving average @ 0.9037
| Trends | Trends.1 | |
|---|---|---|
| 0 | Daily SMA20 | 0.8896 |
| 1 | Daily SMA50 | 0.8788 |
| 2 | Daily SMA100 | 0.8882 |
| 3 | Daily SMA200 | 0.9037 |
The previous day high was 0.8996 while the previous day low was 0.8932. The daily 38.2% Fib levels comes at 0.8971, expected to provide support. Similarly, the daily 61.8% fib level is at 0.8956, expected to provide support.
Note the levels of interest below:
- Pivot support is noted at 0.8947, 0.8908, 0.8884
- Pivot resistance is noted at 0.9011, 0.9035, 0.9074
| Levels | Levels.1 |
|---|---|
| Previous Daily High | 0.8996 |
| Previous Daily Low | 0.8932 |
| Previous Weekly High | 0.8978 |
| Previous Weekly Low | 0.8897 |
| Previous Monthly High | 0.8876 |
| Previous Monthly Low | 0.8690 |
| Daily Fibonacci 38.2% | 0.8971 |
| Daily Fibonacci 61.8% | 0.8956 |
| Daily Pivot Point S1 | 0.8947 |
| Daily Pivot Point S2 | 0.8908 |
| Daily Pivot Point S3 | 0.8884 |
| Daily Pivot Point R1 | 0.9011 |
| Daily Pivot Point R2 | 0.9035 |
| Daily Pivot Point R3 | 0.9074 |
[/s2If]
Download Nehcap EAWe have two EAs that are operational on our LIVE accounts.
- EA-FIX: Check out the details here. Download EA-FIX . EA-FIX is a non-grid HFT scalper.
- EA-GROWTH: High quality low dd EA using trend grids. Download EA_GROWTHJoin Our Telegram Group
")


