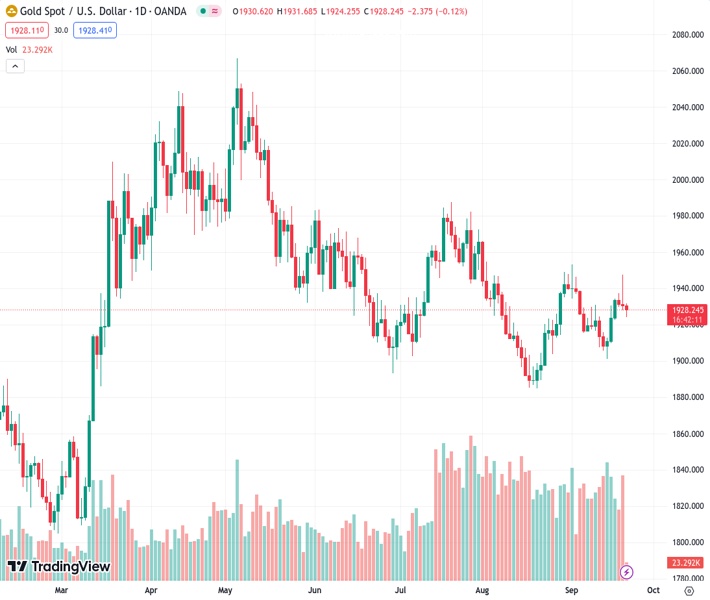
The gold price is currently at $1,928 after being unable to break through the $1,948 level.
…
This is a premium post.
[s2If !current_user_can(access_s2member_level4)]Please register for FREE REGISTER to read full post below containing analysis. In case of any error or you think you are not able to read the full post below, please email us at support#nehcap.com [lwa][/s2If] [s2If current_user_can(access_s2member_level1)]
- Gold price currently trades around $1,928 after seeing a rejection from the $1,948 mark.
The pair currently trades last at 1928.36.
The previous day high was 1947.47 while the previous day low was 1927.99. The daily 38.2% Fib levels comes at 1935.43, expected to provide resistance. Similarly, the daily 61.8% fib level is at 1940.03, expected to provide resistance.
Gold price (XAU/USD) experiences a partial recovery from its recent decline of around $1,928 during the Asian trading hours on Thursday. Gold price remains under selling pressure as the Federal Reserve (Fed) held the benchmark policy rates at 5.5% while delivering the hawkish remarks.
The Federal Reserve (Fed) held interest rates steady at the 5.25-5.50% range during its September meeting, as widely predicted in the market. Officials are more optimistic that they might curb inflation without damaging the economy or causing significant job losses. Fed Chairman Jerome Powell reaffirmed the Fed’s commitment to achieving 2% inflation in a press conference. Powel added that the Fed is ready to raise rates if necessary.
According to the Fed’s most recent quarterly predictions, the benchmark overnight interest rate may be hiked one more time this year to a peak range of 5.50% to 5.75%, and rates could be significantly tighter through 2024 than previously anticipated. Additionally, the Fed updated its Summary of Projections (SEP), indicating that Fed officials expect interest rates to reach 5.1% by the end of 2024 (from 4.6% prior). It’s worth noting that rising interest rates raise the opportunity cost of investing in non-yielding assets, implying a negative outlook for precious metals.
Gold traders will keep an eye on the US weekly Jobless Claims, the Philly Fed, and Existing Home Sales due later on Thursday. On Friday, the preliminary US S&P Global PMI for September will be released. These figures could provide a clear direction for gold price.
On the four-hour chart, gold price saw a rejection from the $1,948 mark following the Fed interest rate decision. The precious metal has remained well supported above the 100-hour Exponential Moving Average (EMA) at $1924.
Meanwhile, the Relative Strength Index (RSI) is located in the 40-60 zone, indicating a non-directional movement for gold price for the time being.
Resistance level: $1,950, $1,965 and $1,982
Support level: $1,924, $1,915 and $1,900
Technical Levels: Supports and Resistances
XAUUSD currently trading at 1928.36 at the time of writing. Pair opened at 1930.34 and is trading with a change of -0.1 % .
| Overview | Overview.1 | |
|---|---|---|
| 0 | Today last price | 1928.36 |
| 1 | Today Daily Change | -1.98 |
| 2 | Today Daily Change % | -0.10 |
| 3 | Today daily open | 1930.34 |
The pair is trading above its 20 Daily moving average @ 1925.31, below its 50 Daily moving average @ 1931.44 , below its 100 Daily moving average @ 1944.49 and above its 200 Daily moving average @ 1924.26
| Trends | Trends.1 | |
|---|---|---|
| 0 | Daily SMA20 | 1925.31 |
| 1 | Daily SMA50 | 1931.44 |
| 2 | Daily SMA100 | 1944.49 |
| 3 | Daily SMA200 | 1924.26 |
The previous day high was 1947.47 while the previous day low was 1927.99. The daily 38.2% Fib levels comes at 1935.43, expected to provide resistance. Similarly, the daily 61.8% fib level is at 1940.03, expected to provide resistance.
Note the levels of interest below:
- Pivot support is noted at 1923.06, 1915.79, 1903.58
- Pivot resistance is noted at 1942.54, 1954.75, 1962.02
| Levels | Levels.1 |
|---|---|
| Previous Daily High | 1947.47 |
| Previous Daily Low | 1927.99 |
| Previous Weekly High | 1930.77 |
| Previous Weekly Low | 1901.07 |
| Previous Monthly High | 1966.08 |
| Previous Monthly Low | 1884.85 |
| Daily Fibonacci 38.2% | 1935.43 |
| Daily Fibonacci 61.8% | 1940.03 |
| Daily Pivot Point S1 | 1923.06 |
| Daily Pivot Point S2 | 1915.79 |
| Daily Pivot Point S3 | 1903.58 |
| Daily Pivot Point R1 | 1942.54 |
| Daily Pivot Point R2 | 1954.75 |
| Daily Pivot Point R3 | 1962.02 |
[/s2If]
Download Nehcap EAWe have two EAs that are operational on our LIVE accounts.
- EA-FIX: Check out the details here. Download EA-FIX . EA-FIX is a non-grid HFT scalper.
- EA-GROWTH: High quality low dd EA using trend grids. Download EA_GROWTHJoin Our Telegram Group
")


