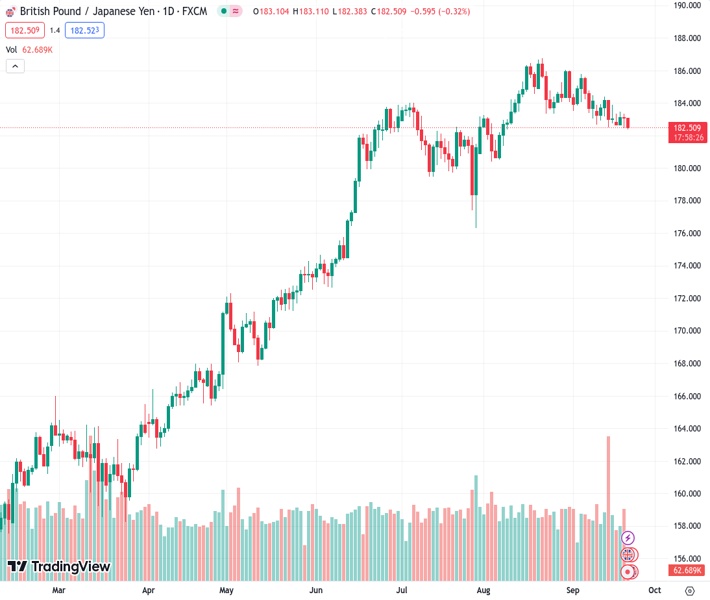
The GBPJPY currency pair, which was trading at 182.521, encountered a new influx of selling pressure on Thursday, causing it to decline to its lowest point since August 9.
…
This is a premium post.
[s2If !current_user_can(access_s2member_level4)]Please register for FREE REGISTER to read full post below containing analysis. In case of any error or you think you are not able to read the full post below, please email us at support#nehcap.com [lwa][/s2If] [s2If current_user_can(access_s2member_level1)]
- GBP/JPY meets with a fresh supply on Thursday and drops to its lowest level since August 9.
The pair currently trades last at 182.521.
The previous day high was 183.35 while the previous day low was 182.46. The daily 38.2% Fib levels comes at 182.8, expected to provide resistance. Similarly, the daily 61.8% fib level is at 183.01, expected to provide resistance.
The GBP/JPY cross comes under some renewed selling pressure during the Asian session on Thursday and drops to the 182.40 area, or its lowest level since August 9 in the last hour.
The British Pound (GBP) continues with its relative underperformance in the wake of expectations for an imminent pause in the Bank of England’s (BoE) rate-hiking cycle, which, in turn, is seen weighing on the GBP/JPY cross. Data released from the UK on Wednesday showed that the annual headline CPI fell to 6.7% in August from 6.8% in July, defying the consensus forecast for a rise to 7%. Moreover, importantly the core CPI – excluding volatile food, energy, alcohol and tobacco prices – came in at 6.2% in the 12 months to the end of August, down from 6.9% in July. The markets were quick to react and scaled back bets for a BOE rate hike to reflect a 50:50 chance of a hold.
The Japanese Yen (JPY), on the other hand, gets a minor lift in reaction to comments by Japan’s Chief Cabinet Secretary Hirokazu Matsuno, saying that he won’t rule out any options for response to FX moves. This raises the risk of an intervention by authorities to prop up the domestic currency. Apart from this, speculations that the Bank of Japan (BoJ) could move away from the ultra-loose policy, along with a softer risk tone, benefit the safe-haven JPY and exert additional pressure on the GBP/JPY cross. BoJ Governor Kazuo Ueda had said that ending negative interest rates is among the options available if the central bank becomes confident that prices and wages will keep going up sustainably.
It, however, remains to be seen if bearish traders can maintain their dominant position or opt to lighten their bets ahead of the key central bank event risks – the crucial BoE policy decision on Thursday, followed by the highly-anticipated BoJ meeting on Friday. Nevertheless, the aforementioned fundamental backdrop seems tilted in favour of bearish traders. Adding to this, this week’s repeated failures near the 50-day Simple Moving Average (SMA) support breakpoint, now turned resistance, suggests that the path of least resistance for the GBP/JPY cross is to the downside. Hence, any attempted recovery move might still be seen as a selling opportunity and fizzle out rather quickly.
Technical Levels: Supports and Resistances
GBPJPY currently trading at 182.48 at the time of writing. Pair opened at 183.12 and is trading with a change of -0.35 % .
| Overview | Overview.1 | |
|---|---|---|
| 0 | Today last price | 182.48 |
| 1 | Today Daily Change | -0.64 |
| 2 | Today Daily Change % | -0.35 |
| 3 | Today daily open | 183.12 |
The pair is trading below its 20 Daily moving average @ 184.06, below its 50 Daily moving average @ 183.26 , above its 100 Daily moving average @ 179.83 and above its 200 Daily moving average @ 171.08
| Trends | Trends.1 | |
|---|---|---|
| 0 | Daily SMA20 | 184.06 |
| 1 | Daily SMA50 | 183.26 |
| 2 | Daily SMA100 | 179.83 |
| 3 | Daily SMA200 | 171.08 |
The previous day high was 183.35 while the previous day low was 182.46. The daily 38.2% Fib levels comes at 182.8, expected to provide resistance. Similarly, the daily 61.8% fib level is at 183.01, expected to provide resistance.
Note the levels of interest below:
- Pivot support is noted at 182.61, 182.09, 181.72
- Pivot resistance is noted at 183.49, 183.86, 184.38
| Levels | Levels.1 |
|---|---|
| Previous Daily High | 183.35 |
| Previous Daily Low | 182.46 |
| Previous Weekly High | 184.39 |
| Previous Weekly Low | 182.52 |
| Previous Monthly High | 186.77 |
| Previous Monthly Low | 180.46 |
| Daily Fibonacci 38.2% | 182.80 |
| Daily Fibonacci 61.8% | 183.01 |
| Daily Pivot Point S1 | 182.61 |
| Daily Pivot Point S2 | 182.09 |
| Daily Pivot Point S3 | 181.72 |
| Daily Pivot Point R1 | 183.49 |
| Daily Pivot Point R2 | 183.86 |
| Daily Pivot Point R3 | 184.38 |
[/s2If]
Download Nehcap EAWe have two EAs that are operational on our LIVE accounts.
- EA-FIX: Check out the details here. Download EA-FIX . EA-FIX is a non-grid HFT scalper.
- EA-GROWTH: High quality low dd EA using trend grids. Download EA_GROWTHJoin Our Telegram Group
")


