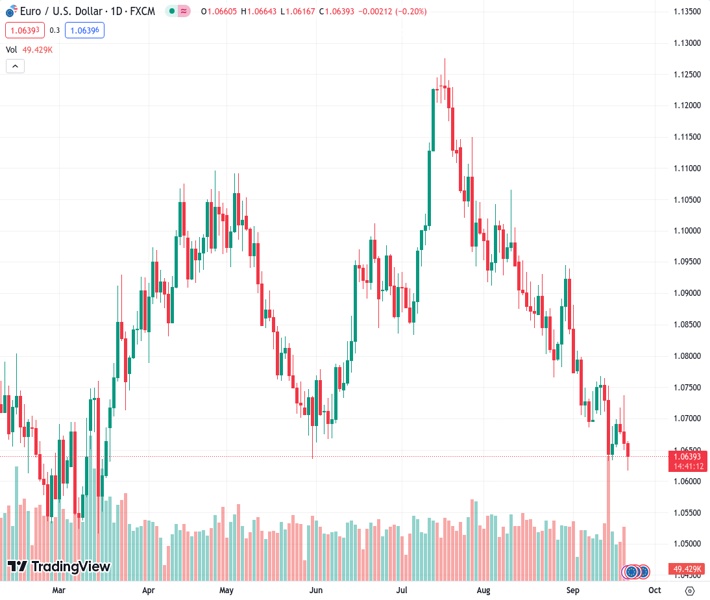
The EURUSD currency pair, currently trading at 1.06392, is facing downward pressure as a result of the Federal Reserve’s forecast indicating a possibility of another interest rate increase in 2023.
…
This is a premium post.
[s2If !current_user_can(access_s2member_level4)]Please register for FREE REGISTER to read full post below containing analysis. In case of any error or you think you are not able to read the full post below, please email us at support#nehcap.com [lwa][/s2If] [s2If current_user_can(access_s2member_level1)]
- EUR/USD experiences pressure due to the Fed’s projection of an additional rate hike in 2023.
The pair currently trades last at 1.06392.
The previous day high was 1.0737 while the previous day low was 1.065. The daily 38.2% Fib levels comes at 1.0683, expected to provide resistance. Similarly, the daily 61.8% fib level is at 1.0704, expected to provide resistance.
EUR/USD extends the losses for the third successive day. Spot price is trading lower around 1.0640 during the Asian session on Thursday. As expected, the US Federal Reserve (Fed) chose to maintain the current benchmark policy rates at 5.5% during the meeting convened on Wednesday.
The Fed’s projection of an additional rate hike in 2023 has exerted downward pressure on the EUR/USD pair. Furthermore, in its monetary policy statement, the Federal Open Market Committee (FOMC) has indicated an anticipation of slightly higher inflation compared to its previous forecasts.
The six-month low at 1.0616 marked on Thursday could act as immediate support, followed by the 1.0600 psychological level.
On the upside, the 18-day Exponential Moving Average (EMA) at 1.0728 appears to be the key barrier aligned to the 21-day EMA at the 1.0742 level.
A break above the latter could provide support for the pair to navigate the region around the 23.6% Fibonacci retracement at 1.0772, followed by the 1.0800 psychological level.
The Moving Average Convergence Divergence (MACD) line remains below the centerline but is at the same level as the signal line. This configuration suggests that the momentum in the underlying asset’s price is relatively neutral, with neither bullish nor bearish dominance.
However, the momentum in the EUR/USD pair indicates bearish sentiment in the market as the 14-day Relative Strength Index (RSI) remains below the 50 level.
Technical Levels: Supports and Resistances
EURUSD currently trading at 1.0635 at the time of writing. Pair opened at 1.066 and is trading with a change of -0.23 % .
| Overview | Overview.1 | |
|---|---|---|
| 0 | Today last price | 1.0635 |
| 1 | Today Daily Change | -0.0025 |
| 2 | Today Daily Change % | -0.2300 |
| 3 | Today daily open | 1.0660 |
The pair remains strongly bearish on the daily time frame. It trades below the 20 SMA @ 1.0753, 50 SMA 1.0908, 100 SMA @ 1.0885 and 200 SMA @ 1.0829.
| Trends | Trends.1 | |
|---|---|---|
| 0 | Daily SMA20 | 1.0753 |
| 1 | Daily SMA50 | 1.0908 |
| 2 | Daily SMA100 | 1.0885 |
| 3 | Daily SMA200 | 1.0829 |
The previous day high was 1.0737 while the previous day low was 1.065. The daily 38.2% Fib levels comes at 1.0683, expected to provide resistance. Similarly, the daily 61.8% fib level is at 1.0704, expected to provide resistance.
Note the levels of interest below:
- Pivot support is noted at 1.0628, 1.0596, 1.0541
- Pivot resistance is noted at 1.0715, 1.0769, 1.0802
| Levels | Levels.1 |
|---|---|
| Previous Daily High | 1.0737 |
| Previous Daily Low | 1.0650 |
| Previous Weekly High | 1.0769 |
| Previous Weekly Low | 1.0632 |
| Previous Monthly High | 1.1065 |
| Previous Monthly Low | 1.0766 |
| Daily Fibonacci 38.2% | 1.0683 |
| Daily Fibonacci 61.8% | 1.0704 |
| Daily Pivot Point S1 | 1.0628 |
| Daily Pivot Point S2 | 1.0596 |
| Daily Pivot Point S3 | 1.0541 |
| Daily Pivot Point R1 | 1.0715 |
| Daily Pivot Point R2 | 1.0769 |
| Daily Pivot Point R3 | 1.0802 |
[/s2If]
Download Nehcap EAWe have two EAs that are operational on our LIVE accounts.
- EA-FIX: Check out the details here. Download EA-FIX . EA-FIX is a non-grid HFT scalper.
- EA-GROWTH: High quality low dd EA using trend grids. Download EA_GROWTHJoin Our Telegram Group
")


