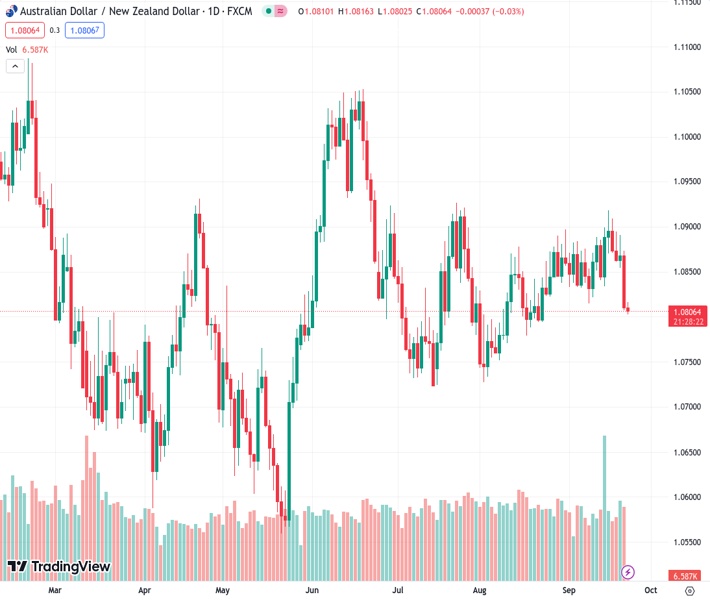
The currency pair AUDNZD, currently at a rate of 1.08140, is experiencing prolonged decreases, continuing the downward trend that started on Wednesday.
…
This is a premium post.
[s2If !current_user_can(access_s2member_level4)]Please register for FREE REGISTER to read full post below containing analysis. In case of any error or you think you are not able to read the full post below, please email us at support#nehcap.com [lwa][/s2If] [s2If current_user_can(access_s2member_level1)]
- AUD/NZD is seeing extended declines, continuing Wednesday’s backslide.
The pair currently trades last at 1.08140.
The previous day high was 1.0892 while the previous day low was 1.0855. The daily 38.2% Fib levels comes at 1.0878, expected to provide resistance. Similarly, the daily 61.8% fib level is at 1.0869, expected to provide resistance.
The AUD/NZD has broken out of recent consolidation on the weak side, and the pair shrugged off a mixed trade balance printing from New Zealand (NZ) as markets focus on weakened manufacturing figures from the Australian Purchasing Manager Index (PMI) printing.
Read more:
Australia: S&P Global Manufacturing PMI drops to 48.2, Services PMI improves to 50.5 in September
New Zealand Trade Balance came in mixed for August, NZD/USD remains flat above 0.5900
Australian PMI figures came in mixed, with the services component seeing a minor bump into 50.5 from 47.8, but weak spots in the manufacturing component are keeping the Aussie (AUD) on the weak side, with the Manufacturing PMI declining further to 48.2 from 49.6.
The Aussie-Kiwi pair has tumbled into the 200-day Simple Moving Average currently capping off prices near 1.0820.
Continued declines will see the pair testing August’s early lows near 1.0720, while a bullish recovery will see the AUD/NZD challenging the recent swing high into 1.0920.
Technical Levels: Supports and Resistances
AUDNZD currently trading at 1.0808 at the time of writing. Pair opened at 1.0876 and is trading with a change of -0.63 % .
| Overview | Overview.1 | |
|---|---|---|
| 0 | Today last price | 1.0808 |
| 1 | Today Daily Change | -0.0068 |
| 2 | Today Daily Change % | -0.6300 |
| 3 | Today daily open | 1.0876 |
The pair remains strongly bearish on the daily time frame. It trades below the 20 SMA @ 1.0866, 50 SMA 1.0838, 100 SMA @ 1.0828 and 200 SMA @ 1.0818.
| Trends | Trends.1 | |
|---|---|---|
| 0 | Daily SMA20 | 1.0866 |
| 1 | Daily SMA50 | 1.0838 |
| 2 | Daily SMA100 | 1.0828 |
| 3 | Daily SMA200 | 1.0818 |
The previous day high was 1.0892 while the previous day low was 1.0855. The daily 38.2% Fib levels comes at 1.0878, expected to provide resistance. Similarly, the daily 61.8% fib level is at 1.0869, expected to provide resistance.
Note the levels of interest below:
- Pivot support is noted at 1.0857, 1.0837, 1.082
- Pivot resistance is noted at 1.0894, 1.0911, 1.0931
| Levels | Levels.1 |
|---|---|
| Previous Daily High | 1.0892 |
| Previous Daily Low | 1.0855 |
| Previous Weekly High | 1.0919 |
| Previous Weekly Low | 1.0825 |
| Previous Monthly High | 1.0897 |
| Previous Monthly Low | 1.0732 |
| Daily Fibonacci 38.2% | 1.0878 |
| Daily Fibonacci 61.8% | 1.0869 |
| Daily Pivot Point S1 | 1.0857 |
| Daily Pivot Point S2 | 1.0837 |
| Daily Pivot Point S3 | 1.0820 |
| Daily Pivot Point R1 | 1.0894 |
| Daily Pivot Point R2 | 1.0911 |
| Daily Pivot Point R3 | 1.0931 |
[/s2If]
Download Nehcap EAWe have two EAs that are operational on our LIVE accounts.
- EA-FIX: Check out the details here. Download EA-FIX . EA-FIX is a non-grid HFT scalper.
- EA-GROWTH: High quality low dd EA using trend grids. Download EA_GROWTHJoin Our Telegram Group
")


