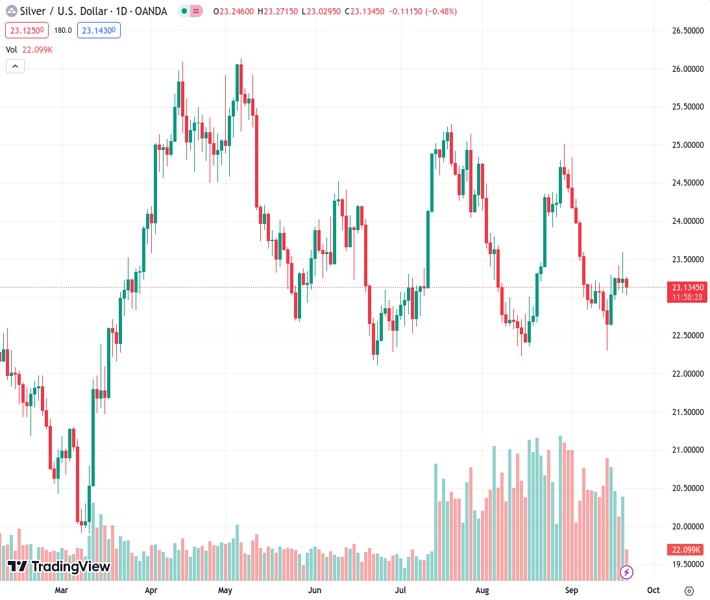
Silver, also known as XAGUSD, successfully recovers from a brief decline to around $23.00 but fails to maintain upward momentum.
…
This is a premium post.
[s2If !current_user_can(access_s2member_level4)]Please register for FREE REGISTER to read full post below containing analysis. In case of any error or you think you are not able to read the full post below, please email us at support#nehcap.com [lwa][/s2If] [s2If current_user_can(access_s2member_level1)]
- Silver reverses an intraday dip to the $23.00 neighbourhood, albeit lacks follow-through.
The pair currently trades last at 23.137.
The previous day high was 23.59 while the previous day low was 23.05. The daily 38.2% Fib levels comes at 23.39, expected to provide resistance. Similarly, the daily 61.8% fib level is at 23.26, expected to provide resistance.
Silver attracts some dip-buying in the vicinity of the $23.00 mark on Thursday and climbs to the top end of its intraday trading range during the first half of the European session. The white metal is currently placed around the $23.25 region and for now, seems to have stalled its retracement slide from the $23.60 area, or a two-week high touched on Wednesday.
The lack of follow-through, however, warrants some caution for the XAG/USD bulls, against the backdrop of the previous day’s failure to find acceptance above a technically significant 200-day Simple Moving Average (SMA). Moreover, oscillators on the daily chart – though have been recovering from lower levels – are still holding in the negative territory. Hence, it will be prudent to wait for some follow-through buying beyond the overnight swing high, around the $23.60 region, before positioning for any further appreciating move.
The XAG/USD might then aim to surpass the 100-day SMA and accelerate the momentum towards reclaiming the $24.00 round-figure mark. The next relevant hurdle is pegged near the $24.30-$24.35 region, which if cleared decisively should pave the way for a move towards the $25.00 psychological mark.
The latter coincides with the August monthly swing high and is followed by the July peak, around the $25.25 region, which if cleared will set the stage for the recent bounce from an ascending trend line extending from the June swing low.
On the flip side, the $23.00 mark might continue to protect the immediate downside. Any further slide below the weekly trough, around the $22.95 region, could find decent support near the $22.30 region, or a nearly one-month low touched last Thursday. A convincing break below the said support levels will confirm a fresh breakdown and make the XAG/USD vulnerable. The white metal could then accelerate the downward trajectory towards the next relevant support near the $21.25 zone before eventually dropping to the $21.00 round figure.
Technical Levels: Supports and Resistances
XAGUSD currently trading at 23.17 at the time of writing. Pair opened at 23.25 and is trading with a change of -0.34 % .
| Overview | Overview.1 | |
|---|---|---|
| 0 | Today last price | 23.17 |
| 1 | Today Daily Change | -0.08 |
| 2 | Today Daily Change % | -0.34 |
| 3 | Today daily open | 23.25 |
The pair remains strongly bearish on the daily time frame. It trades below the 20 SMA @ 23.58, 50 SMA 23.72, 100 SMA @ 23.67 and 200 SMA @ 23.47.
| Trends | Trends.1 | |
|---|---|---|
| 0 | Daily SMA20 | 23.58 |
| 1 | Daily SMA50 | 23.72 |
| 2 | Daily SMA100 | 23.67 |
| 3 | Daily SMA200 | 23.47 |
The previous day high was 23.59 while the previous day low was 23.05. The daily 38.2% Fib levels comes at 23.39, expected to provide resistance. Similarly, the daily 61.8% fib level is at 23.26, expected to provide resistance.
Note the levels of interest below:
- Pivot support is noted at 23.0, 22.76, 22.46
- Pivot resistance is noted at 23.54, 23.84, 24.08
| Levels | Levels.1 |
|---|---|
| Previous Daily High | 23.59 |
| Previous Daily Low | 23.05 |
| Previous Weekly High | 23.29 |
| Previous Weekly Low | 22.30 |
| Previous Monthly High | 25.02 |
| Previous Monthly Low | 22.23 |
| Daily Fibonacci 38.2% | 23.39 |
| Daily Fibonacci 61.8% | 23.26 |
| Daily Pivot Point S1 | 23.00 |
| Daily Pivot Point S2 | 22.76 |
| Daily Pivot Point S3 | 22.46 |
| Daily Pivot Point R1 | 23.54 |
| Daily Pivot Point R2 | 23.84 |
| Daily Pivot Point R3 | 24.08 |
[/s2If]
Download Nehcap EAWe have two EAs that are operational on our LIVE accounts.
- EA-FIX: Check out the details here. Download EA-FIX . EA-FIX is a non-grid HFT scalper.
- EA-GROWTH: High quality low dd EA using trend grids. Download EA_GROWTHJoin Our Telegram Group
")


