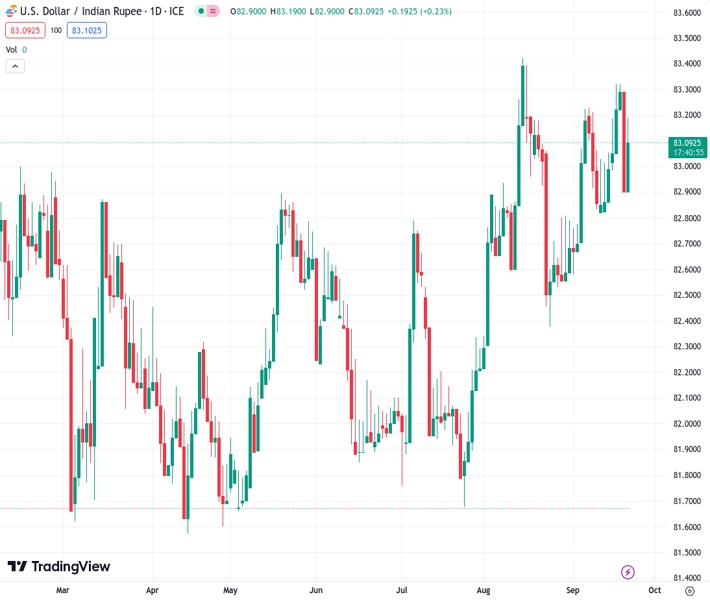
On Thursday, the USDINR rate of 83.0900 started to gain momentum in a positive direction again, as it managed to recover some of the losses it had experienced the day before.
…
This is a premium post.
[s2If !current_user_can(access_s2member_level4)]Please register for FREE REGISTER to read full post below containing analysis. In case of any error or you think you are not able to read the full post below, please email us at support#nehcap.com [lwa][/s2If] [s2If current_user_can(access_s2member_level1)]
- USD/INR regains positive traction on Thursday and recovers a part of the previous day’s losses.
The pair currently trades last at 83.0900.
The previous day high was 83.8456 while the previous day low was 82.8835. The daily 38.2% Fib levels comes at 83.251, expected to provide resistance. Similarly, the daily 61.8% fib level is at 83.478, expected to provide resistance.
The USD/INR pair attracts fresh buyers near the 82.90 region on Thursday and reverses a part of the previous day’s downfall from the 83.30 area, or over a one-month top. Spot prices currently trade just above the 83.00 mark and remain well within the striking distance of the all-time peak touched on August 15.
From a technical perspective, the fact that the USD/INR pair is holding comfortably above technically significant 100-day and 200-day Simple Moving Averages (SMAs) favours bullish traders. Moreover, oscillators on the daily chart are holding in the positive territory and are still far from being in the overbought one. This, in turn, suggests that the path of least resistance for spot prices is to the upside.
Hence, a subsequent strength beyond the overnight swing high, around the 83.30 region, en route to the 83.45 area or the YTD high, remains a distinct possibility. Some follow-through buying will be seen as a fresh trigger for bullish traders and set the stage for a further near-term appreciating move for the USD/INR pair.
On the flip side, the 82.90-82.80 area, might continue to protect the immediate downside. Any further decline is more likely to attract fresh buyers and remain limited near the 82.40-82.30 confluence, comprising the 100-day and the 200-day SMAs. The latter should act as a pivotal point, which if broken will make the USD/INR pair vulnerable to accelerate the corrective decline towards the 82.00 mark.
Technical Levels: Supports and Resistances
USDINR currently trading at 83.0292 at the time of writing. Pair opened at 83.0594 and is trading with a change of -0.04 % .
| Overview | Overview.1 | |
|---|---|---|
| 0 | Today last price | 83.0292 |
| 1 | Today Daily Change | -0.0302 |
| 2 | Today Daily Change % | -0.0400 |
| 3 | Today daily open | 83.0594 |
The pair remains strongly bullish on the daily timeframe. It trades above its 20 SMA @ 82.9377, 50 SMA 82.7207, 100 SMA @ 82.5058 and 200 SMA @ 82.3579.
| Trends | Trends.1 | |
|---|---|---|
| 0 | Daily SMA20 | 82.9377 |
| 1 | Daily SMA50 | 82.7207 |
| 2 | Daily SMA100 | 82.5058 |
| 3 | Daily SMA200 | 82.3579 |
The previous day high was 83.8456 while the previous day low was 82.8835. The daily 38.2% Fib levels comes at 83.251, expected to provide resistance. Similarly, the daily 61.8% fib level is at 83.478, expected to provide resistance.
Note the levels of interest below:
- Pivot support is noted at 82.6801, 82.3008, 81.7181
- Pivot resistance is noted at 83.6422, 84.2249, 84.6042
| Levels | Levels.1 |
|---|---|
| Previous Daily High | 83.8456 |
| Previous Daily Low | 82.8835 |
| Previous Weekly High | 83.2896 |
| Previous Weekly Low | 82.5035 |
| Previous Monthly High | 83.5505 |
| Previous Monthly Low | 82.2240 |
| Daily Fibonacci 38.2% | 83.2510 |
| Daily Fibonacci 61.8% | 83.4780 |
| Daily Pivot Point S1 | 82.6801 |
| Daily Pivot Point S2 | 82.3008 |
| Daily Pivot Point S3 | 81.7181 |
| Daily Pivot Point R1 | 83.6422 |
| Daily Pivot Point R2 | 84.2249 |
| Daily Pivot Point R3 | 84.6042 |
[/s2If]
Download Nehcap EAWe have two EAs that are operational on our LIVE accounts.
- EA-FIX: Check out the details here. Download EA-FIX . EA-FIX is a non-grid HFT scalper.
- EA-GROWTH: High quality low dd EA using trend grids. Download EA_GROWTHJoin Our Telegram Group
")


