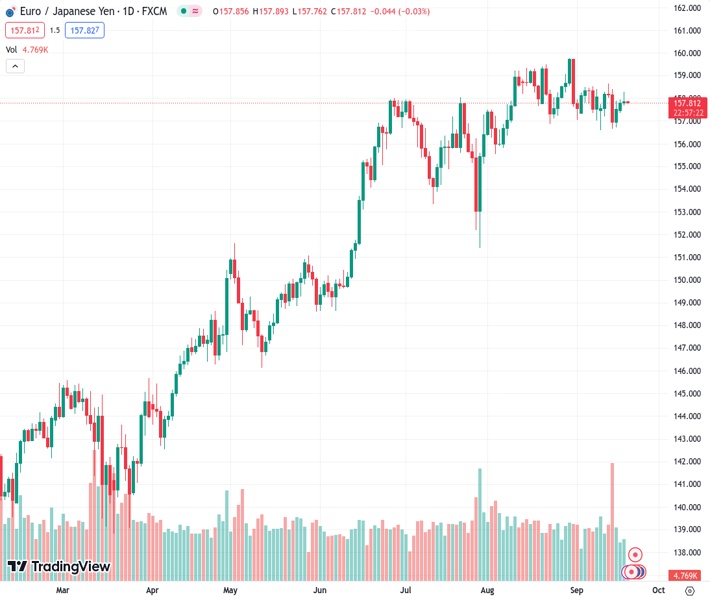
The EURJPY currency pair rose sharply from a value of 157.804 to reach a peak of 158.23, surpassing the 20-day simple moving average (SMA), before eventually ending at 157.85.
…
This is a premium post.
[s2If !current_user_can(access_s2member_level4)]Please register for FREE REGISTER to read full post below containing analysis. In case of any error or you think you are not able to read the full post below, please email us at support#nehcap.com [lwa][/s2If] [s2If current_user_can(access_s2member_level1)]
- EUR/JPY soared to a high of 158.23, above the 20-day SMA and then closed at 157.85.
The pair currently trades last at 157.804.
The previous day high was 157.94 while the previous day low was 157.35. The daily 38.2% Fib levels comes at 157.71, expected to provide support. Similarly, the daily 61.8% fib level is at 157.57, expected to provide support.
In Tuesday’s session, the EUR/JPY cross failed to maintain its momentum, which took the pair to a high of 157.85, above the 20-day Simple Moving Average (SMA) and closed with mild gains at 157.85.
Based on the daily chart, the EUR/JPY continues to show indications of bullish exhaustion, leading to a neutral to bearish technical outlook. The Relative Strength Index (RSI) shows a flat slope over its midline and suggests that the bullish momentum is slowly fading away. This is supported by the Moving Average Convergence (MACD), which lays out flat red bars. It’s worth mentioning that the RSI has displayed a downward trend since the beginning of September and lines with the pair being constantly rejected by the 20-day SMA.
That being said, the pair is above the 100 and 200-day SMAs, highlighting the continued dominance of bulls in the broader perspective.
Support levels: 157.00, 155.00, 154.60 (100-day SMA).
Resistance levels: 158.00 (20-day SMA), 158.50, 159.00.
Technical Levels: Supports and Resistances
EURJPY currently trading at 157.89 at the time of writing. Pair opened at 157.82 and is trading with a change of 0.04 % .
| Overview | Overview.1 | |
|---|---|---|
| 0 | Today last price | 157.89 |
| 1 | Today Daily Change | 0.07 |
| 2 | Today Daily Change % | 0.04 |
| 3 | Today daily open | 157.82 |
The pair is trading below its 20 Daily moving average @ 158.03, above its 50 Daily moving average @ 157.26 , above its 100 Daily moving average @ 154.56 and above its 200 Daily moving average @ 148.81
| Trends | Trends.1 | |
|---|---|---|
| 0 | Daily SMA20 | 158.03 |
| 1 | Daily SMA50 | 157.26 |
| 2 | Daily SMA100 | 154.56 |
| 3 | Daily SMA200 | 148.81 |
The previous day high was 157.94 while the previous day low was 157.35. The daily 38.2% Fib levels comes at 157.71, expected to provide support. Similarly, the daily 61.8% fib level is at 157.57, expected to provide support.
Note the levels of interest below:
- Pivot support is noted at 157.46, 157.11, 156.87
- Pivot resistance is noted at 158.05, 158.29, 158.64
| Levels | Levels.1 |
|---|---|
| Previous Daily High | 157.94 |
| Previous Daily Low | 157.35 |
| Previous Weekly High | 158.66 |
| Previous Weekly Low | 156.58 |
| Previous Monthly High | 159.76 |
| Previous Monthly Low | 155.53 |
| Daily Fibonacci 38.2% | 157.71 |
| Daily Fibonacci 61.8% | 157.57 |
| Daily Pivot Point S1 | 157.46 |
| Daily Pivot Point S2 | 157.11 |
| Daily Pivot Point S3 | 156.87 |
| Daily Pivot Point R1 | 158.05 |
| Daily Pivot Point R2 | 158.29 |
| Daily Pivot Point R3 | 158.64 |
[/s2If]
Download Nehcap EAWe have two EAs that are operational on our LIVE accounts.
- EA-FIX: Check out the details here. Download EA-FIX . EA-FIX is a non-grid HFT scalper.
- EA-GROWTH: High quality low dd EA using trend grids. Download EA_GROWTHJoin Our Telegram Group
")


