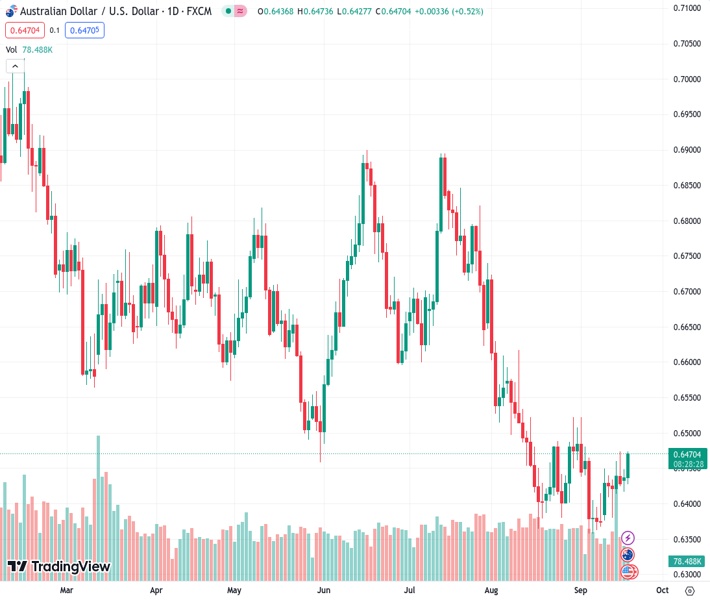
The AUDUSD currency pair surges above the 0.6430 level as the US Dollar is under selling pressure before the Federal Reserve’s decision on monetary policy.
…
This is a premium post.
[s2If !current_user_can(access_s2member_level4)]Please register for FREE REGISTER to read full post below containing analysis. In case of any error or you think you are not able to read the full post below, please email us at support#nehcap.com [lwa][/s2If] [s2If current_user_can(access_s2member_level1)]
- AUD/USD climbs sharply above 0.6430 as the US Dollar faces selling pressure ahead of the Fed policy.
The pair currently trades last at 0.64708.
The previous day high was 0.6449 while the previous day low was 0.6417. The daily 38.2% Fib levels comes at 0.6437, expected to provide support. Similarly, the daily 61.8% fib level is at 0.6429, expected to provide support.
The AUD/USD pair delivers an upside break of the consolidation formed in a range of 0.6430-0.6450 in the European session. The Aussie asset picks strength as the US Dollar Index (DXY) eases ahead of the Federal Reserve (Fed) monetary policy, which will be announced on Wednesday.
Investors see the Fed keeping interest rates steady at 5.25-5.50% as inflation is consistently cooling while economic prospects are strong. The labor growth in the United States economy has remained steady despite higher interest rates from the Fed. The Fed is expected to keep interest rates higher long enough to ensure price stability.
Meanwhile, the Australian Dollar will remain in action amid the interest rate policy by the People’s Bank of China (PBoC), which will be revealed on Wednesday. A dovish interest rate stance is expected from the PBoC due to upside risks to deflation amid bleak household’ demand.
The US Dollar Index drops sharply below the crucial support of 105.00 and is expected to remain vulnerable ahead.
AUD/USD rebounds after discovering buying interest near the horizontal support plotted from August 17 low around 0.6364 on a two-hour scale. The Aussie asset stabilizes above the 50-day Exponential Moving Average (EMA), which trades around 0.6340. Potential resistance is plotted from August 15 high at 0.6522.
The Relative Strength Index (RSI) (14) jumps above 60.0, which indicates that the bullish impulse has been triggered.
A decisive break above August 15 high around 0.6522 will drive the asset to August 9 high at 0.6571. Breach of the latter will drive the asset towards August 10 high at 0.6616.
On the flip side, a fresh downside would appear if the Aussie asset will drop below August 17 low around 0.6360. This would expose the asset to the round-level support of 0.6300 followed by 03 November 2022 low at 0.6272.
Technical Levels: Supports and Resistances
AUDUSD currently trading at 0.647 at the time of writing. Pair opened at 0.6437 and is trading with a change of 0.51 % .
| Overview | Overview.1 | |
|---|---|---|
| 0 | Today last price | 0.6470 |
| 1 | Today Daily Change | 0.0033 |
| 2 | Today Daily Change % | 0.5100 |
| 3 | Today daily open | 0.6437 |
The pair is trading above its 20 Daily moving average @ 0.6431, below its 50 Daily moving average @ 0.6552 , below its 100 Daily moving average @ 0.6615 and below its 200 Daily moving average @ 0.6703
| Trends | Trends.1 | |
|---|---|---|
| 0 | Daily SMA20 | 0.6431 |
| 1 | Daily SMA50 | 0.6552 |
| 2 | Daily SMA100 | 0.6615 |
| 3 | Daily SMA200 | 0.6703 |
The previous day high was 0.6449 while the previous day low was 0.6417. The daily 38.2% Fib levels comes at 0.6437, expected to provide support. Similarly, the daily 61.8% fib level is at 0.6429, expected to provide support.
Note the levels of interest below:
- Pivot support is noted at 0.642, 0.6402, 0.6387
- Pivot resistance is noted at 0.6452, 0.6466, 0.6484
| Levels | Levels.1 |
|---|---|
| Previous Daily High | 0.6449 |
| Previous Daily Low | 0.6417 |
| Previous Weekly High | 0.6474 |
| Previous Weekly Low | 0.6378 |
| Previous Monthly High | 0.6724 |
| Previous Monthly Low | 0.6364 |
| Daily Fibonacci 38.2% | 0.6437 |
| Daily Fibonacci 61.8% | 0.6429 |
| Daily Pivot Point S1 | 0.6420 |
| Daily Pivot Point S2 | 0.6402 |
| Daily Pivot Point S3 | 0.6387 |
| Daily Pivot Point R1 | 0.6452 |
| Daily Pivot Point R2 | 0.6466 |
| Daily Pivot Point R3 | 0.6484 |
[/s2If]
Download Nehcap EAWe have two EAs that are operational on our LIVE accounts.
- EA-FIX: Check out the details here. Download EA-FIX . EA-FIX is a non-grid HFT scalper.
- EA-GROWTH: High quality low dd EA using trend grids. Download EA_GROWTHJoin Our Telegram Group
")


