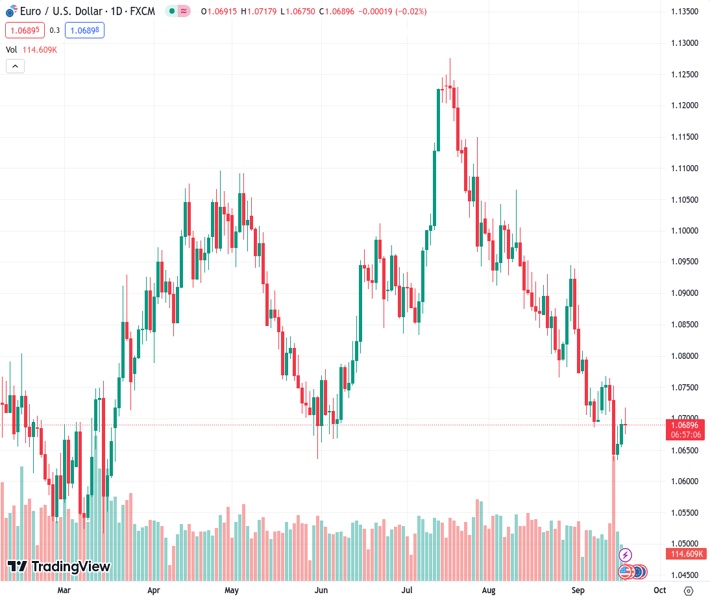
On Tuesday, the recovery of the EURUSD pair briefly exceeded the important level of 1.0700.
…
This is a premium post.
[s2If !current_user_can(access_s2member_level4)]Please register for FREE REGISTER to read full post below containing analysis. In case of any error or you think you are not able to read the full post below, please email us at support#nehcap.com [lwa][/s2If] [s2If current_user_can(access_s2member_level1)]
- EUR/USD’s recovery briefly surpasses the key 1.0700 threshold on Tuesday.
The pair currently trades last at 1.06920.
The previous day high was 1.0699 while the previous day low was 1.0655. The daily 38.2% Fib levels comes at 1.0682, expected to provide support. Similarly, the daily 61.8% fib level is at 1.0672, expected to provide support.
EUR/USD trades in a volatile fashion and looks to consolidate a breakout of the 1.0700 hurdle on Tuesday.
If the rebound gathers extra steam, the pair should face a minor hurdle at the weekly high of 1.0767 (September 12) prior to the critical 200-day SMA at 1.0828.
While below the key 200-day SMA, the pair is likely to face extra weakness.
Technical Levels: Supports and Resistances
EURUSD currently trading at 1.069 at the time of writing. Pair opened at 1.0692 and is trading with a change of -0.02 % .
| Overview | Overview.1 | |
|---|---|---|
| 0 | Today last price | 1.0690 |
| 1 | Today Daily Change | 42.0000 |
| 2 | Today Daily Change % | -0.0200 |
| 3 | Today daily open | 1.0692 |
The pair remains strongly bearish on the daily time frame. It trades below the 20 SMA @ 1.0771, 50 SMA 1.0924, 100 SMA @ 1.0892 and 200 SMA @ 1.0829.
| Trends | Trends.1 | |
|---|---|---|
| 0 | Daily SMA20 | 1.0771 |
| 1 | Daily SMA50 | 1.0924 |
| 2 | Daily SMA100 | 1.0892 |
| 3 | Daily SMA200 | 1.0829 |
The previous day high was 1.0699 while the previous day low was 1.0655. The daily 38.2% Fib levels comes at 1.0682, expected to provide support. Similarly, the daily 61.8% fib level is at 1.0672, expected to provide support.
Note the levels of interest below:
- Pivot support is noted at 1.0665, 1.0638, 1.0621
- Pivot resistance is noted at 1.0709, 1.0726, 1.0753
| Levels | Levels.1 |
|---|---|
| Previous Daily High | 1.0699 |
| Previous Daily Low | 1.0655 |
| Previous Weekly High | 1.0769 |
| Previous Weekly Low | 1.0632 |
| Previous Monthly High | 1.1065 |
| Previous Monthly Low | 1.0766 |
| Daily Fibonacci 38.2% | 1.0682 |
| Daily Fibonacci 61.8% | 1.0672 |
| Daily Pivot Point S1 | 1.0665 |
| Daily Pivot Point S2 | 1.0638 |
| Daily Pivot Point S3 | 1.0621 |
| Daily Pivot Point R1 | 1.0709 |
| Daily Pivot Point R2 | 1.0726 |
| Daily Pivot Point R3 | 1.0753 |
[/s2If]
Download Nehcap EAWe have two EAs that are operational on our LIVE accounts.
- EA-FIX: Check out the details here. Download EA-FIX . EA-FIX is a non-grid HFT scalper.
- EA-GROWTH: High quality low dd EA using trend grids. Download EA_GROWTHJoin Our Telegram Group
")


